Quantitative Methods — July 2024
KNEC Diploma in Sales and Marketing — Module II. Paper code: 2902/204
Independent worked revision answers. These are not official KNEC marking schemes. Every printed question is covered for revision, including all subparts. Retain unrounded values until the final step.
The production figures in Question 3(b), including 74 and 76 units, and the fractions in Question 7(b) were checked visually against the scan. The independence assumption needed for Question 7(b) is stated in its answer.
Question 1(a)
Explain five advantages of using secondary data in a research. (10 marks)
Answer
- Lower collection cost: using existing records or published datasets usually avoids the expense of carrying out a new field survey.
- Faster access: already collected data can support an investigation within a shorter time.
- Historical analysis: past records allow researchers to study changes and trends that cannot be observed retrospectively through a new survey.
- Broader coverage: large existing datasets may cover more places, sectors or years than an individual researcher could collect directly.
- Supports research design and comparison: existing findings help define the problem, develop hypotheses and compare new primary results with earlier evidence.
Question 1(b)
The following information shows the ages of workers and the corresponding marks they scored in an aptitude test.
| Age (years) | Marks (%) |
|---|---|
| 35 | 45 |
| 44 | 70 |
| 25 | 62 |
| 55 | 85 |
| 32 | 50 |
| 20 | 65 |
| 22 | 73 |
| 47 | 40 |
- (i) Calculate the Pearson’s coefficient of correlation.
- (ii) Interpret the results in (i) above.
(10 marks)
Answer
(i) Pearson correlation coefficient
| x: age | y: marks | x² | y² | xy |
|---|---|---|---|---|
| 35 | 45 | 1225 | 2025 | 1575 |
| 44 | 70 | 1936 | 4900 | 3080 |
| 25 | 62 | 625 | 3844 | 1550 |
| 55 | 85 | 3025 | 7225 | 4675 |
| 32 | 50 | 1024 | 2500 | 1600 |
| 20 | 65 | 400 | 4225 | 1300 |
| 22 | 73 | 484 | 5329 | 1606 |
| 47 | 40 | 2209 | 1600 | 1880 |
| 280 | 490 | 10928 | 31648 | 17266 |
| Step | Working |
|---|---|
| Formula | r = [nΣxy − (Σx)(Σy)] / √{[nΣx² − (Σx)²][nΣy² − (Σy)²]} |
| Numerator | 8(17,266) − 280(490) = 928 |
| First denominator term | 8(10,928) − 280² = 9,024 |
| Second denominator term | 8(31,648) − 490² = 13,084 |
| Substitution | r = 928/√(9,024 × 13,084) |
| Coefficient | r = 0.085404 ≈ 0.0854 |
(ii) Interpretation
The coefficient is positive but very close to zero. These observations show a very weak positive linear association between age and test marks; age has little linear relationship with marks in this sample. This does not establish causation or rule out other forms of relationship.
Question 2(a)
Highlight five differences between correlation analysis and regression analysis. (10 marks)
Answer
| Aspect | Correlation analysis | Regression analysis |
|---|---|---|
| Purpose | Measures the direction and strength of association. | Models a relationship to explain or predict a response variable. |
| Roles of variables | Treats the two variables symmetrically; neither has to be designated as the response. | Distinguishes a dependent/response variable from explanatory/predictor variables. |
| Output | Produces an association coefficient, such as Pearson’s r. | Produces an equation with an intercept and one or more slope coefficients. |
| Units and range | Pearson’s r is unit-free and lies between −1 and +1. | Regression coefficients generally carry units and are not restricted to −1 to +1. |
| Interchanging variables | Exchanging x and y leaves Pearson’s r unchanged. | Regression of y on x generally differs from regression of x on y; one cannot normally reverse the fitted equation to obtain the other. |
Question 2(b)
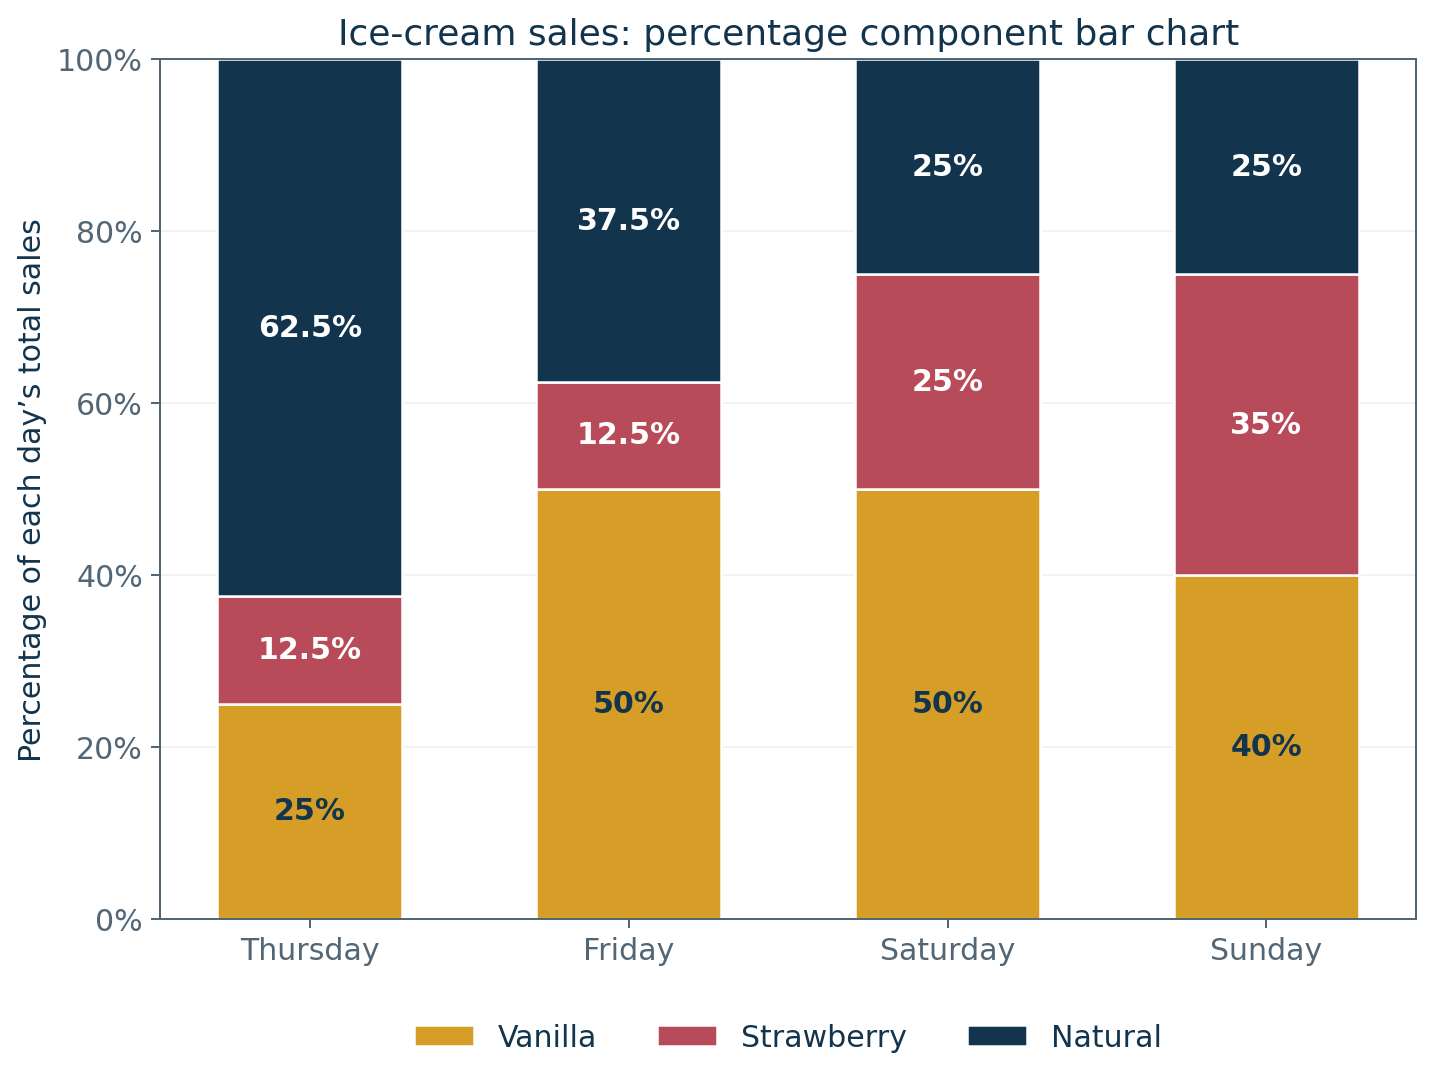
The following information shows the quantities of three flavours of ice cream sold by a vendor on Thursday, Friday, Saturday and Sunday.
| Day of the week | Vanilla | Strawberry | Natural |
|---|---|---|---|
| Thursday | 12 | 6 | 30 |
| Friday | 20 | 5 | 15 |
| Saturday | 60 | 30 | 30 |
| Sunday | 40 | 35 | 25 |
Present the information in a percentage component bar chart. (10 marks)
Answer
For each day, total the three flavours and convert each quantity to a percentage of that day’s total. Component percentage = (flavour quantity/daily total) × 100. Every completed bar therefore has height 100%.
| Day | Total sold | Vanilla % | Strawberry % | Natural % |
|---|---|---|---|---|
| Thursday | 48 | 25% | 12.5% | 62.5% |
| Friday | 40 | 50% | 12.5% | 37.5% |
| Saturday | 120 | 50% | 25% | 25% |
| Sunday | 100 | 40% | 35% | 25% |
For example, Thursday’s Vanilla component = (12/48) × 100 = 25%. Its Strawberry component is 12.5% and Natural is 62.5%.
Question 3(a)
Outline four advantages of using the stratified sampling method in data collection. (8 marks)
Answer
- It ensures that important population subgroups are represented when a sample is selected from every defined stratum.
- It can improve precision over a simple random sample of the same total size when units within each stratum are relatively similar.
- It provides separate estimates for individual strata as well as an overall population estimate.
- It allows sampling effort to be allocated according to stratum size, variability or collection cost, improving the use of available resources.
Question 3(b)
The following information shows the number of units of a commodity produced by Dela Limited over a period of 7 years.
| Years | Number of units produced |
|---|---|
| 2016 | 45 |
| 2017 | 60 |
| 2018 | 74 |
| 2019 | 85 |
| 2020 | 90 |
| 2021 | 76 |
| 2022 | 50 |
- (i) Determine the trend line equation.
- (ii) Using the equation in (i) above, estimate the number of units to be produced in the year 2023.
(12 marks)
Answer
(i) Least-squares trend line
Use t = year − 2019, so Σt = 0. In the regression table below, x is the time code t.
| t = year − 2019 | Y: units produced | x² | xy |
|---|---|---|---|
| -3 | 45 | 9 | -135 |
| -2 | 60 | 4 | -120 |
| -1 | 74 | 1 | -74 |
| 0 | 85 | 0 | 0 |
| 1 | 90 | 1 | 90 |
| 2 | 76 | 4 | 152 |
| 3 | 50 | 9 | 150 |
| 0 | 480 | 28 | 63 |
| Step | Working |
|---|---|
| Number of observations | n = 7 |
| Slope b | [nΣxy − (Σx)(Σy)] / [nΣx² − (Σx)²] |
| Substitute | [7(63) − 0(480)] / [7(28) − (0)²] = 2.25 |
| Intercept a | ȳ − bx̄ = 68.571429 − (2.25)(0) = 68.571429 |
| Regression equation | ŷ = 68.571429 + 2.25x |
Trend equation: Ŷ = 68.571429 + 2.25t, where t = year − 2019.
(ii) Forecast for 2023
| Step | Working |
|---|---|
| Time code | t = 2023 − 2019 = 4 |
| Estimate | Ŷ = 68.571429 + 2.25(4) = 77.571429 units |
| Whole-unit approximation | Approximately 78 units |
Question 4(a)
Distinguish between each of the following terms as used in probability theory:
- (i) Poisson distribution and normal distribution;
- (ii) equally likely events and mutually exclusive events.
(8 marks)
Answer
| Pair | First term | Second term |
|---|---|---|
| (i) | Poisson distribution: a discrete probability distribution for counts of events in a specified interval under assumptions such as independent occurrences at a constant average rate. Its values are non-negative integers and its mean and variance are λ. | Normal distribution: a continuous, symmetric bell-shaped distribution specified by mean μ and variance σ². It models continuous values, with total area under its curve equal to 1. |
| (ii) | Equally likely events: events with the same probability of occurring; the phrase concerns their probability sizes. | Mutually exclusive events: events that cannot occur together on the same trial, so their intersection has probability zero. They need not have equal probabilities. |
Question 4(b)
The following information shows the distributions of the sales of companies operating in the same industry.
| Sales (Ksh ‘000’) | Number of companies |
|---|---|
| 0–5 | 4 |
| 5–10 | 12 |
| 10–15 | 26 |
| 15–20 | 38 |
| 20–25 | 22 |
| 25–30 | 15 |
| 30–35 | 7 |
Calculate the:
- (i) arithmetic mean;
- (ii) median;
- (iii) mode.
(12 marks)
Answer
| Sales class | Frequency f | Midpoint x | fx | Cumulative frequency |
|---|---|---|---|---|
| 0–5 | 4 | 2.5 | 10 | 4 |
| 5–10 | 12 | 7.5 | 90 | 16 |
| 10–15 | 26 | 12.5 | 325 | 42 |
| 15–20 | 38 | 17.5 | 665 | 80 |
| 20–25 | 22 | 22.5 | 495 | 102 |
| 25–30 | 15 | 27.5 | 412.5 | 117 |
| 30–35 | 7 | 32.5 | 227.5 | 124 |
| Total | 124 | — | 2,225 | — |
Use continuous adjoining intervals with class width h = 5. All calculated sales are in Ksh ‘000’.
| Measure | Working | Result |
|---|---|---|
| (i) Arithmetic mean | Σfx/N = 2,225/124 | 17.943548 thousand shillings |
| (ii) Median | L + [(N/2 − CF before)/f]h = 15 + [(62 − 42)/38] × 5 | 17.631579 thousand shillings |
| (iii) Mode | L + [(f₁ − f₀)/(2f₁ − f₀ − f₂)]h = 15 + [(38 − 26)/(76 − 26 − 22)] × 5 | 17.142857 thousand shillings |
The median and modal class are both 15–20. In shillings, the estimated mean is Ksh 17,943.55, median Ksh 17,631.58 and mode Ksh 17,142.86.
Question 5(a)
Outline five characteristics of a good measure of dispersion. (10 marks)
Answer
- It is rigidly and unambiguously defined, so the same observations give the same value.
- It is reasonably easy to understand and compute.
- It takes account of all observations rather than relying on only a few selected values.
- It is reasonably stable from sample to sample for the same population.
- It is suitable for further mathematical or statistical analysis, allowing useful comparison and combination of results.
Question 5(b)
A company intends to invest Ksh 2,600,000 in either Project X or Project Y. The following are the expected net cash inflow from the projects.
| Year | Project X (Ksh) | Project Y (Ksh) |
|---|---|---|
| 1 | 200,000 | 450,000 |
| 2 | 750,000 | 1,000,000 |
| 3 | 1,020,000 | 1,200,000 |
| 4 | 1,120,000 | 700,000 |
| 5 | 900,000 | 240,000 |
The company is cost of capital is 10%.
- (i) Calculate the Net Present Value (NPV) of each project.
- (ii) Based on the results in (i) above, advise the management on the project to invest in.
(10 marks)
Answer
(i) NPV calculations
Assume the Ksh 2,600,000 investment is paid now and cash inflows occur at the end of each stated year. NPV = Σ[CFₜ/(1.10)ᵗ] − initial investment.
| Year | Discount factor | X cash inflow | X present value | Y cash inflow | Y present value |
|---|---|---|---|---|---|
| 1 | 0.909091 | 200,000 | 181,818.18 | 450,000 | 409,090.91 |
| 2 | 0.826446 | 750,000 | 619,834.71 | 1,000,000 | 826,446.28 |
| 3 | 0.751315 | 1,020,000 | 766,341.10 | 1,200,000 | 901,577.76 |
| 4 | 0.683013 | 1,120,000 | 764,975.07 | 700,000 | 478,109.42 |
| 5 | 0.620921 | 900,000 | 558,829.19 | 240,000 | 149,021.12 |
| Total PV | — | — | 2,891,798.25 | — | 2,764,245.49 |
| Project | Total PV of inflows | Less initial investment | NPV (Ksh) |
|---|---|---|---|
| X | 2,891,798.25 | 2,600,000.00 | 291,798.25 |
| Y | 2,764,245.49 | 2,600,000.00 | 164,245.49 |
(ii) Recommendation
Choose Project X. Its NPV of Ksh 291,798.25 exceeds Project Y’s Ksh 164,245.49 by Ksh 127,552.76. Both NPVs are positive, but the question permits investment in either one project, so X adds the greater present value under the stated estimates and discount rate.
Question 6(a)
Distinguish between each of the following terms as used in financial mathematics:
- (i) simple interest and compound interest;
- (ii) annuity and perpetuity.
(8 marks)
Answer
| Pair | First term | Second term |
|---|---|---|
| (i) | Simple interest is calculated only on the original principal for every period. For rate r per period and t periods, interest I = Prt and amount A = P(1 + rt). | Compound interest is calculated on the accumulated balance, including earlier interest. With annual compounding, A = P(1 + r)ᵗ. |
| (ii) | An annuity is a series of equal payments at regular intervals for a specified finite number of periods. | A perpetuity is a series of equal payments at regular intervals continuing indefinitely; an ordinary level perpetuity has present value payment/r when r > 0. |
Question 6(b)
The following information shows the distribution of advertising expenses incurred by companies in the same industry.
| Advertising expenses (Ksh ‘000’) | Number of companies |
|---|---|
| 0–10 | 4 |
| 10–20 | 10 |
| 20–30 | 15 |
| 30–40 | 39 |
| 40–50 | 30 |
| 50–60 | 20 |
| 60–70 | 12 |
(i) Calculate the:
- I. arithmetic mean;
- II. standard deviation;
- III. mode.
(ii) Using the results in (i) above, calculate the coefficient of skewness.
(12 marks)
Answer
| Class / value | f | x | fx | fx² |
|---|---|---|---|---|
| 0–10 | 4 | 5 | 20 | 100 |
| 10–20 | 10 | 15 | 150 | 2,250 |
| 20–30 | 15 | 25 | 375 | 9,375 |
| 30–40 | 39 | 35 | 1,365 | 47,775 |
| 40–50 | 30 | 45 | 1,350 | 60,750 |
| 50–60 | 20 | 55 | 1,100 | 60,500 |
| 60–70 | 12 | 65 | 780 | 50,700 |
| Total | 130 | — | 5,140 | 231,450 |
Use class midpoints and continuous adjoining intervals. N = 130. Calculated expenses are in Ksh ‘000’; the population standard deviation uses N.
| Measure | Working | Result |
|---|---|---|
| (i)(I) Mean | Σfx/N = 5,140/130 | 39.538462 |
| Variance used for SD | Σfx²/N − x̄² = 231,450/130 − (5,140/130)² | 217.094675 |
| (i)(II) Standard deviation | σ = √217.094675 | 14.734133 |
| (i)(III) Mode | 30 + [(39 − 15)/(2(39) − 15 − 30)] × 10 | 37.272727 |
The modal class is 30–40, with frequency 39; the preceding and following frequencies are 15 and 30.
(ii) Pearson’s coefficient of skewness
| Step | Working |
|---|---|
| Formula | Sk = (mean − mode)/standard deviation |
| Substitution | (39.538462 − 37.272727)/14.734133 |
| Coefficient | 0.153775 |
| Interpretation | Slight positive (right) skewness |
Question 7(a)
Distinguish between each of the following types of data classification:
- (i) chronological classification and geographical classification;
- (ii) qualitative classification and quantitative classification.
(8 marks)
Answer
| Pair | First term | Second term |
|---|---|---|
| (i) | Chronological classification arranges observations by time, such as sales by month or year. | Geographical classification arranges observations by location, such as sales by county or region. |
| (ii) | Qualitative classification groups observations by attributes or categories, such as department, occupation or product type. | Quantitative classification groups observations by numerical magnitude, such as age groups, income intervals or number of employees. |
Question 7(b)
The probability that Alice, Ben and Celestine will be shortlisted for a job interview is 1/5, 2/9 and 1/3 respectively. Calculate the probability that:
- (i) all of them will be shortlisted for the interview;
- (ii) none will be shortlisted for the interview;
- (iii) at least one of them will be shortlisted for interview;
- (iv) at least two of them will be shortlisted for the interview.
(12 marks)
Answer
Assume that the three shortlisting outcomes are independent. The question does not state this explicitly; without an independence assumption or joint probabilities, the individual probabilities alone do not determine the requested joint outcomes.
| Person | Shortlisted | Not shortlisted |
|---|---|---|
| Alice | 1/5 | 4/5 |
| Ben | 2/9 | 7/9 |
| Celestine | 1/3 | 2/3 |
| Part | Working | Probability |
|---|---|---|
| (i) All three | (1/5)(2/9)(1/3) | 2/135 = 0.014815 |
| (ii) None | (4/5)(7/9)(2/3) | 56/135 = 0.414815 |
| (iii) At least one | 1 − P(none) = 1 − 56/135 | 79/135 = 0.585185 |
(iv) At least two shortlisted
Add the disjoint outcomes of exactly two shortlisted and all three shortlisted.
| Outcome | Working | Probability |
|---|---|---|
| Alice and Ben only | (1/5)(2/9)(2/3) | 4/135 |
| Alice and Celestine only | (1/5)(7/9)(1/3) | 7/135 |
| Ben and Celestine only | (4/5)(2/9)(1/3) | 8/135 |
| All three | (1/5)(2/9)(1/3) | 2/135 |
| At least two | 4/135 + 7/135 + 8/135 + 2/135 | 7/45 = 0.155556 |