Quantitative Methods — March/April 2024
KNEC Diploma in Sales and Marketing — Module II. Paper code: 2902/204
Independent worked revision answers. These are not official KNEC marking schemes. Every printed question is covered for revision, including all subparts. Retain unrounded values until the final step.
Question 1(a)
Explain five limitations of using census as a method of data collection. (10 marks)
Answer
- High cost: contacting and recording every population unit requires substantial spending on staff, transport, systems and supervision.
- Time consuming: covering the entire population and processing all returns may take so long that findings become outdated.
- Difficult administration: large or geographically dispersed populations require complex coordination and consistent field procedures.
- Non-sampling errors remain: omissions, non-response, inaccurate answers and processing mistakes can affect results even though every unit is intended to be covered.
- Unsuitable for destructive or inaccessible populations: testing every item may destroy the stock, while very large, mobile or poorly defined populations may be impossible to enumerate fully.
Question 1(b)
The following is the distribution of profits of companies in two sectors: A and B:
| Profits, Ksh.000’s | Number of Companies: Sector A | Number of Companies: Sector B |
|---|---|---|
| 40–60 | 5 | 2 |
| 60–80 | 30 | 10 |
| 80–100 | 55 | 72 |
| 100–120 | 18 | 14 |
| 120–140 | 18 | 42 |
| 140–160 | 10 | 20 |
| 160–180 | 5 | 16 |
| 180–200 | 2 | 10 |
- (i) mean profit for each sector;
- (ii) Combined mean profit for the two sectors
(10 marks)
Answer
Use the class midpoint x to estimate each class’s profit. All amounts in the working table are in Ksh ‘000’.
| Profit class | Midpoint x | fA | fAx | fB | fBx |
|---|---|---|---|---|---|
| 40–60 | 50 | 5 | 250 | 2 | 100 |
| 60–80 | 70 | 30 | 2100 | 10 | 700 |
| 80–100 | 90 | 55 | 4950 | 72 | 6480 |
| 100–120 | 110 | 18 | 1980 | 14 | 1540 |
| 120–140 | 130 | 18 | 2340 | 42 | 5460 |
| 140–160 | 150 | 10 | 1500 | 20 | 3000 |
| 160–180 | 170 | 5 | 850 | 16 | 2720 |
| 180–200 | 190 | 2 | 380 | 10 | 1900 |
| Total | — | 143 | 14350 | 186 | 21900 |
(i) Mean profit for each sector
| Sector | Working | Mean profit |
|---|---|---|
| A | ΣfAx/ΣfA = 14,350/143 = 100.34965 thousand | Ksh 100,349.65 |
| B | ΣfBx/ΣfB = 21,900/186 = 117.741935 thousand | Ksh 117,741.94 |
(ii) Combined mean
| Step | Working |
|---|---|
| Total estimated profits | 14,350 + 21,900 = 36,250 thousand shillings |
| Total companies | 143 + 186 = 329 |
| Combined mean | 36,250/329 = 110.182371 thousand shillings = Ksh 110,182.37 |
The combined mean weights each sector by its number of companies; it is not the simple average of the two sector means.
Question 2(a)
Outline five advantages of using the simple random sampling method in data collection. (10 marks)
Answer
- Every population unit has an equal selection probability under a correctly implemented simple random design.
- Random selection limits deliberate selection bias by the researcher.
- The selection procedure is straightforward when a complete sampling frame is available.
- Standard methods can estimate sampling error and construct confidence intervals from the probability sample.
- It avoids the need to divide the population into strata or clusters before selection, making it convenient for a reasonably homogeneous population with an accessible frame.
Question 2(b)
The following data shows the distribution of marks scored by employees in a proficiency test:
| marks | 20 | 21 | 22 | 23 | 24 | 25 | 26 | 27 | 28 |
|---|---|---|---|---|---|---|---|---|---|
| Number of employees | 24 | 35 | 20 | 80 | 56 | 40 | 8 | 10 | 5 |
Determine the:
- (i) Range;
- (ii) Standard deviation
- (iii) Variance
(10 marks)
Answer
| Class / value | f | x | fx | fx² |
|---|---|---|---|---|
| 20 | 24 | 20 | 480 | 9,600 |
| 21 | 35 | 21 | 735 | 15,435 |
| 22 | 20 | 22 | 440 | 9,680 |
| 23 | 80 | 23 | 1,840 | 42,320 |
| 24 | 56 | 24 | 1,344 | 32,256 |
| 25 | 40 | 25 | 1,000 | 25,000 |
| 26 | 8 | 26 | 208 | 5,408 |
| 27 | 10 | 27 | 270 | 7,290 |
| 28 | 5 | 28 | 140 | 3,920 |
| Total | 278 | — | 6,457 | 150,909 |
N = 278. The table describes the employees’ distribution, so use the population denominator N.
| Part | Working | Answer |
|---|---|---|
| (i) Range | Highest observed mark − lowest observed mark = 28 − 20 | 8 marks |
| Mean used below | Σfx/N = 6,457/278 | 23.226619 marks |
| (iii) Variance | σ² = Σfx²/N − (Σfx/N)² = 150,909/278 − (6,457/278)² | 3.362313 marks² |
| (ii) Standard deviation | σ = √3.362313 | 1.833661 marks |
Question 3(a)
The following data relates to different sectors of an economy:
| Sector | National Income (Ksh. Billions) |
|---|---|
| Agriculture | 400 |
| Industry | 300 |
| Trade | 200 |
| Other Sectors | 300 |
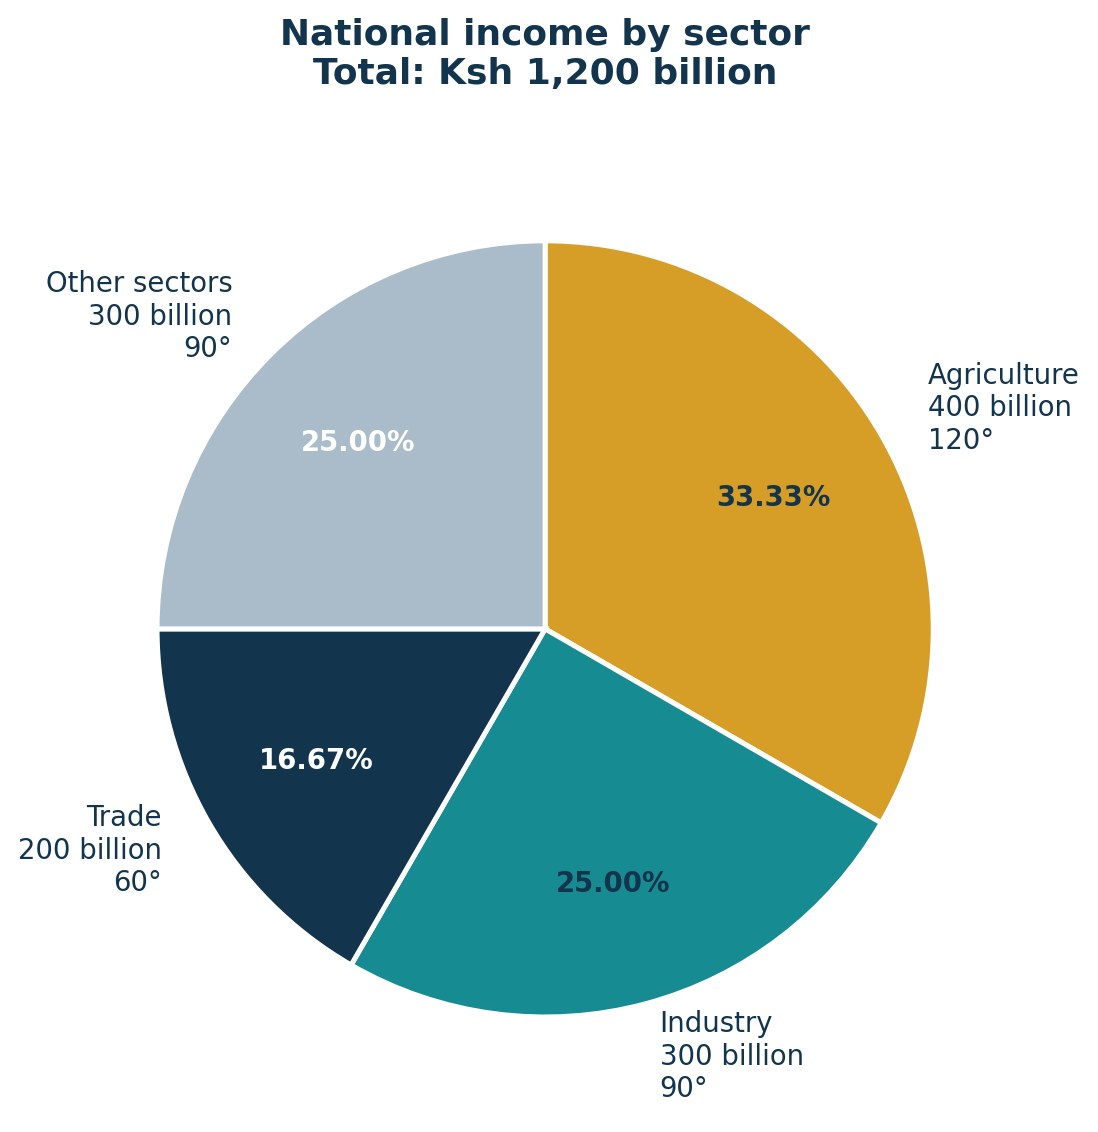
Draw a pie chart from the information (10 marks)
Answer
Total national income = 400 + 300 + 200 + 300 = Ksh 1,200 billion. Sector angle = (sector income/1,200) × 360°.
| Sector | Income (Ksh billion) | Percentage | Sector angle |
|---|---|---|---|
| Agriculture | 400 | 33⅓% | 120° |
| Industry | 300 | 25% | 90° |
| Trade | 200 | 16⅔% | 60° |
| Other sectors | 300 | 25% | 90° |
| Total | 1200 | 100% | 360° |
Question 3(b)
The following data shows the ages of similar machines in a manufacturing firm and their corresponding annual maintenance costs:
| Age (years) | Annual maintenance cost (Ksh.000’s) |
|---|---|
| 5 | 52 |
| 2 | 45 |
| 4 | 50 |
| 3 | 45 |
| 7 | 48 |
| 12 | 47 |
| 2 | 48 |
| 1 | 40 |
- (i) Determine the regression equation of annual maintenance cost on age of the machines.
- (ii) Estimate the annual maintenance cost for machine of 10 years of Age.
(10 marks)
Answer
(i) Regression equation
| x: machine age (years) | y: annual maintenance (Ksh ‘000’) | x² | xy |
|---|---|---|---|
| 5 | 52 | 25 | 260 |
| 2 | 45 | 4 | 90 |
| 4 | 50 | 16 | 200 |
| 3 | 45 | 9 | 135 |
| 7 | 48 | 49 | 336 |
| 12 | 47 | 144 | 564 |
| 2 | 48 | 4 | 96 |
| 1 | 40 | 1 | 40 |
| 36 | 375 | 252 | 1,721 |
| Step | Working |
|---|---|
| Number of observations | n = 8 |
| Slope b | [nΣxy − (Σx)(Σy)] / [nΣx² − (Σx)²] |
| Substitute | [8(1,721) − 36(375)] / [8(252) − (36)²] = 0.372222 |
| Intercept a | ȳ − bx̄ = 46.875 − (0.372222)(4.5) = 45.2 |
| Regression equation | ŷ = 45.2 + 0.372222x |
(ii) Ten-year-old machine
| Step | Working |
|---|---|
| Substitute x = 10 | ŷ = 45.2 + 0.372222(10) = 48.922222 thousand shillings |
| Estimated annual maintenance cost | Ksh 48,922.22 |
Question 4(a)
Explain four limitations of using observation method in the collection of data. (8 marks)
Answer
- It mainly records observable behaviour: motives, attitudes and private experiences cannot usually be established reliably by watching alone.
- Observer bias can affect what is noticed, recorded and interpreted, reducing consistency between observers.
- People may change their behaviour when they know they are being observed, so the record may not reflect normal activity.
- It can be slow and expensive: trained observers may need to wait for rare events or watch activities for long periods, and some settings are inaccessible.
Question 4(b)
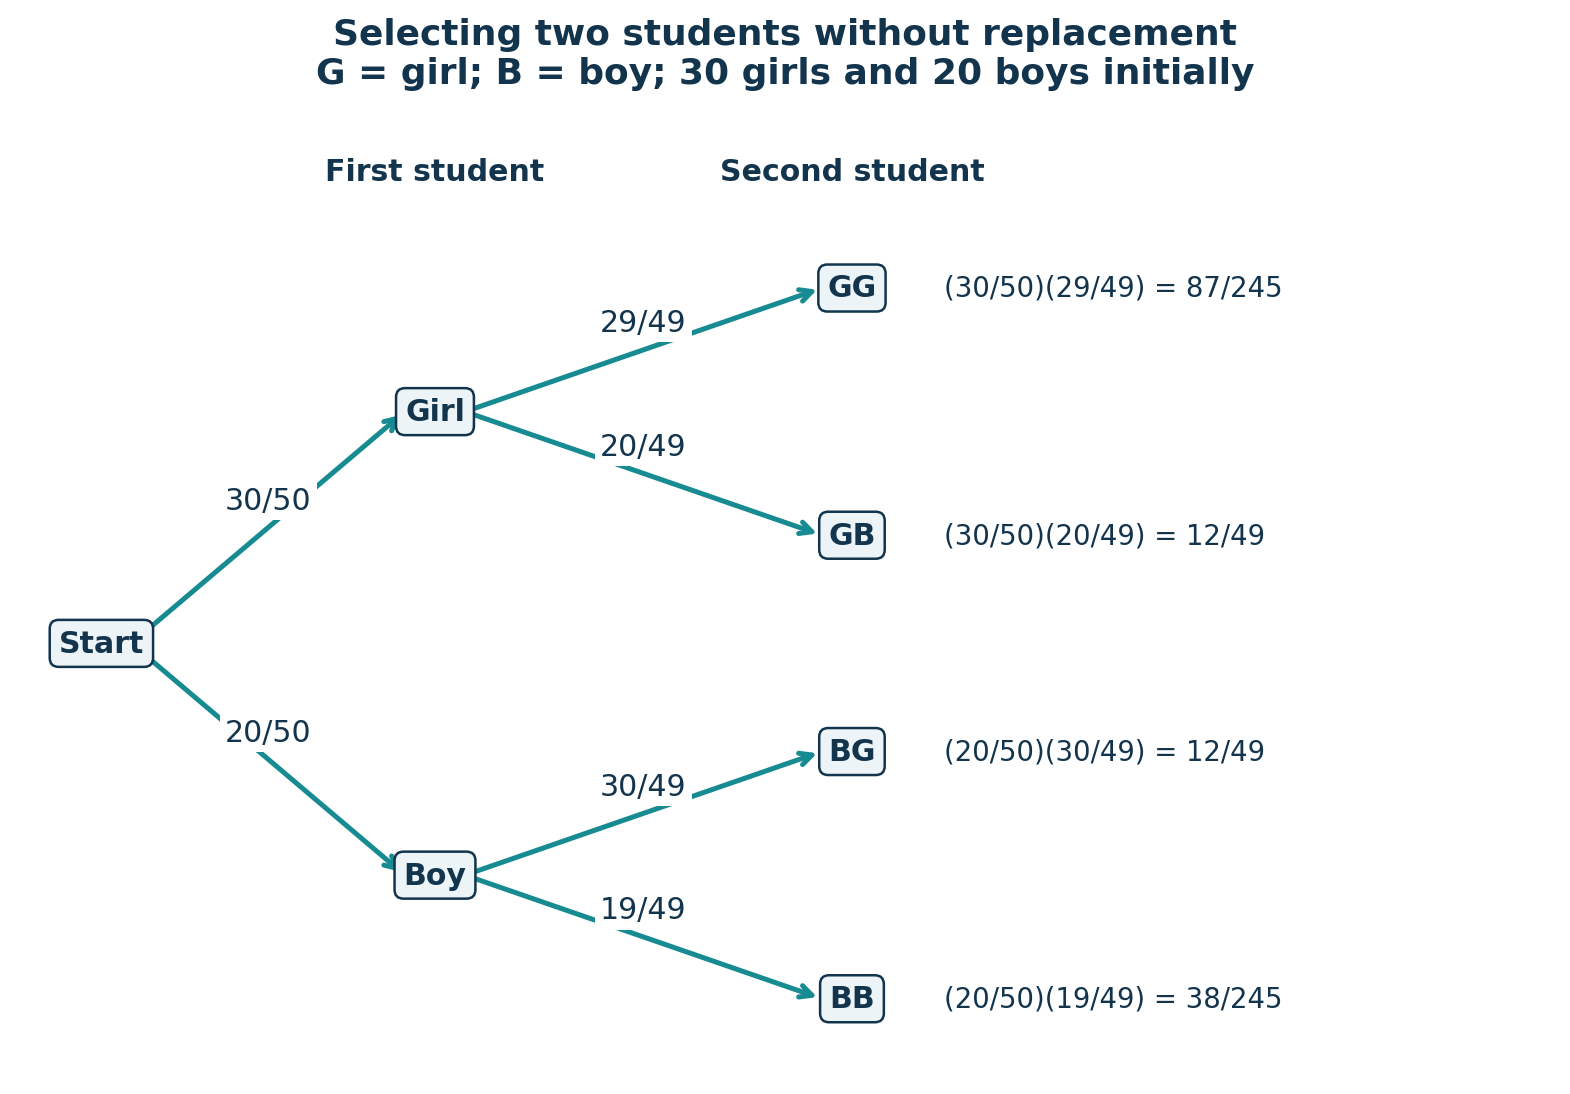
A class has 30 girls and 20 boys. two students are picked at random without replacement to represent the class in a contest.
- (i) Present the information above in a tree diagram.
- (ii) Determine the probability of selecting: (I) 2 girls; (II) 2 boys; (III) a boy and a girl.
(12 marks)
Answer
(i) Tree diagram
There are 50 students initially and 49 after the first selection. Because sampling is without replacement, the second-stage probabilities depend on the first selection.
(ii) Required probabilities
| Event | Working | Probability |
|---|---|---|
| (I) Two girls | (30/50)(29/49) | 87/245 = 0.355102 |
| (II) Two boys | (20/50)(19/49) | 38/245 = 0.155102 |
| Girl then boy | (30/50)(20/49) | 12/49 |
| Boy then girl | (20/50)(30/49) | 12/49 |
| (III) A boy and a girl | P(GB) + P(BG) | 24/49 = 0.489796 |
Both possible orders must be included for “a boy and a girl”. As a check, P(GG) + P(BB) + P(GB) + P(BG) = 1.
Question 5(a)
Explain four disadvantages of regression analysis in business decision making. (8 marks)
Answer
- Dependence on data quality: missing, inaccurate or unrepresentative observations can produce misleading coefficients and forecasts.
- Model assumptions may fail: a fitted straight line can misrepresent a nonlinear relationship, and omitted factors or unusual observations can distort the estimate.
- Association does not establish causation: a regression relationship alone does not show that changing one variable will cause the predicted change in another.
- Forecasting can be unreliable outside the observed range or after structural change: past relationships may not continue under new market conditions.
Question 5(b)
The following data shows the production of wheat in tonnes by a farmer for three consecutive years:
| Year | 1 | 2 | 3 | 4 |
|---|---|---|---|---|
| 2019 | 37 | 38 | 37 | 40 |
| 2020 | 41 | 34 | 25 | 31 |
| 2021 | 25 | 27 | 31 | 29 |
- (i) Determine the trend values using 3-period moving averages.
- (ii) Comment on the results in (i) above.
(12 marks)
Answer
(i) Three-period moving averages
Read the four periods of each year from left to right, then continue into the following year. A three-period moving average is placed at the middle period of its three observations. The first and last periods have no centred three-period value.
| Middle period | Three observations (tonnes) | Three-period total | Moving average (tonnes) |
|---|---|---|---|
| 2019, period 2 | 37 + 38 + 37 | 112 | 37.3333 |
| 2019, period 3 | 38 + 37 + 40 | 115 | 38.3333 |
| 2019, period 4 | 37 + 40 + 41 | 118 | 39.3333 |
| 2020, period 1 | 40 + 41 + 34 | 115 | 38.3333 |
| 2020, period 2 | 41 + 34 + 25 | 100 | 33.3333 |
| 2020, period 3 | 34 + 25 + 31 | 90 | 30 |
| 2020, period 4 | 25 + 31 + 25 | 81 | 27 |
| 2021, period 1 | 31 + 25 + 27 | 83 | 27.6667 |
| 2021, period 2 | 25 + 27 + 31 | 83 | 27.6667 |
| 2021, period 3 | 27 + 31 + 29 | 87 | 29 |
(ii) Comment
The smoothed production rises from about 37.33 tonnes to 39.33 tonnes around late 2019, then falls substantially through 2020. It levels near 27–28 tonnes and recovers slightly to 29 tonnes by the third period of 2021. Overall, the later smoothed values are lower than those at the beginning; the pattern is not a steady decline in every period.
Question 6(a)
Explain five limitations of the mode as a measure of central tendency. (10 marks)
Answer
- It may not exist uniquely: if no value occurs more often than the rest, there is no single most frequent value.
- A distribution can have two or more modes, making one representative central value difficult to choose.
- It ignores most observations: it depends on the most frequent value or class rather than using the magnitude of every observation.
- It can be unstable between samples or change when grouped-data class boundaries are altered.
- It has limited algebraic use: modes cannot generally be combined or manipulated to obtain an overall mode from separate groups using simple totals.
Question 6(b)
The following is the expected net cash inflows from a project:
| Year | 1 | 2 | 3 | 4 | 5 | 6 | 7 | 8 | 9 |
|---|---|---|---|---|---|---|---|---|---|
| Cash-in flows (Ksh.000’S) | 600 | 750 | 500 | 550 | 550 | 550 | 500 | 450 | 550 |
The project’s discount rate is 12%. Calculate the present value of the cash in flows. (10 marks)
Answer
Assume each cash inflow is received at the end of its stated year. Discount each separately using PVₜ = CFₜ/(1 + 0.12)ᵗ. Amounts in the working table are in Ksh ‘000’.
| Year t | Cash inflow | Discount factor 1/(1.12)ᵗ | Present value |
|---|---|---|---|
| 1 | 600 | 0.892857 | 535.71 |
| 2 | 750 | 0.797194 | 597.90 |
| 3 | 500 | 0.71178 | 355.89 |
| 4 | 550 | 0.635518 | 349.53 |
| 5 | 550 | 0.567427 | 312.08 |
| 6 | 550 | 0.506631 | 278.65 |
| 7 | 500 | 0.452349 | 226.17 |
| 8 | 450 | 0.403883 | 181.75 |
| 9 | 550 | 0.36061 | 198.34 |
| Total | — | — | 3,036.02 |
| Result | Amount |
|---|---|
| Present value in table units | 3,036.024222 thousand shillings |
| Present value in shillings | Ksh 3,036,024.22 |
The total is calculated from unrounded discounted cash flows. This is the present value of inflows; no initial outlay is given for an NPV calculation.
Question 7(a)
Outline four advantages of using primary data in the research. (8 marks)
Answer
- It can be collected specifically for the research question, improving relevance to the required population and variables.
- The researcher controls definitions, sampling, measurement instruments and quality checks.
- It can provide current information for the period being studied.
- The researcher knows how the information was obtained and can seek clarification or collect additional detail when necessary.
Question 7(b)
The following is the distribution of salaries paid to employees in two different industries:
| Salaries, Ksh.000’s | Number of Employees: Industry A | Number of Employees: Industry B |
|---|---|---|
| 40–50 | 15 | 5 |
| 50–60 | 20 | 4 |
| 60–70 | 25 | 15 |
| 70–80 | 14 | 20 |
| 80–90 | 10 | 30 |
| 90–100 | 16 | 36 |
- (i) Calculate the Coefficient of variation of the salaries in each industry.
- (ii) Comment on the results in (i) above.
(12 marks)
Answer
(i) Coefficients of variation
Use midpoint estimates and the population standard deviation for each industry: CV = (σ/x̄) × 100%.
| Salary class | Midpoint x | fA | fAx | fAx² | fB | fBx | fBx² |
|---|---|---|---|---|---|---|---|
| 40–50 | 45 | 15 | 675 | 30375 | 5 | 225 | 10125 |
| 50–60 | 55 | 20 | 1100 | 60500 | 4 | 220 | 12100 |
| 60–70 | 65 | 25 | 1625 | 105625 | 15 | 975 | 63375 |
| 70–80 | 75 | 14 | 1050 | 78750 | 20 | 1500 | 112500 |
| 80–90 | 85 | 10 | 850 | 72250 | 30 | 2550 | 216750 |
| 90–100 | 95 | 16 | 1520 | 144400 | 36 | 3420 | 324900 |
| Total | — | 100 | 6820 | 491900 | 110 | 8890 | 739750 |
| Industry | Measure | Working and result |
|---|---|---|
| A | Mean | 6,820/100 = 68.2 |
| A | Variance | 491,900/100 − (6,820/100)² = 267.76 |
| A | Standard deviation | √267.76 = 16.363374 |
| A | CV | (16.363374/68.2) × 100% = 23.9932% |
| B | Mean | 8,890/110 = 80.818182 |
| B | Variance | 739,750/110 − (8,890/110)² = 193.421488 |
| B | Standard deviation | √193.421488 = 13.907605 |
| B | CV | (13.907605/80.818182) × 100% = 17.2085% |
(ii) Comment
Industry B has the lower coefficient of variation, about 17.21% compared with 23.99% for Industry A. Salaries in B therefore vary less relative to their mean and are more consistent. Industry B also has the higher estimated mean salary, about Ksh 80,818.18 compared with Ksh 68,200 for A.