Quantitative Methods — July 2020
KNEC Diploma in Sales and Marketing — Module II. Paper code: 2902/204
Independent worked revision answers. These are not official KNEC marking schemes. Every printed question is covered for revision, including all subparts. Retain unrounded values until the final step.
The scan omits the examination heading. The sitting follows the original source filename recorded in the supplied archive index. A duplicated investment-row label in Question 7(b) is explained beside the answer.
Question 1(a)
Given the following matrices A, B and C:
A =
| Column 1 | Column 2 |
|---|---|
| 20 | 10 |
| 5 | 8 |
| 10 | 15 |
B =
| Column 1 | Column 2 | Column 3 |
|---|---|---|
| 5 | 10 | 20 |
| 8 | 5 | 10 |
| 4 | 10 | 3 |
C =
| Column 1 | Column 2 |
|---|---|
| 10 | 5 |
| 20 | 10 |
| 8 | 10 |
Calculate:
- (i) B × C
- (ii) A + C
- (iii) C − A
(8 marks)
Answer
(i) B × C
B is 3 × 3 and C is 3 × 2, so BC is 3 × 2. Multiply each row of B by each column of C.
| Entry | Working | Result |
|---|---|---|
| Row 1, column 1 | 5 × 10 + 10 × 20 + 20 × 8 | 410 |
| Row 1, column 2 | 5 × 5 + 10 × 10 + 20 × 10 | 325 |
| Row 2, column 1 | 8 × 10 + 5 × 20 + 10 × 8 | 260 |
| Row 2, column 2 | 8 × 5 + 5 × 10 + 10 × 10 | 190 |
| Row 3, column 1 | 4 × 10 + 10 × 20 + 3 × 8 | 264 |
| Row 3, column 2 | 4 × 5 + 10 × 10 + 3 × 10 | 150 |
BC =
| Column 1 | Column 2 |
|---|---|
| 410 | 325 |
| 260 | 190 |
| 264 | 150 |
(ii) A + C
Add corresponding entries, for example 20 + 10 = 30 and 8 + 10 = 18.
| Column 1 | Column 2 |
|---|---|
| 30 | 15 |
| 25 | 18 |
| 18 | 25 |
(iii) C − A
Subtract the corresponding entry of A from C, for example 10 − 20 = −10 and 10 − 15 = −5.
| Column 1 | Column 2 |
|---|---|
| -10 | -5 |
| 15 | 2 |
| -2 | -5 |
Question 1(b)
The following information shows the advertising costs and the sales revenue of Telek Limited over a certain period.
| Advertising costs (x), Ksh ‘000’ | Sales revenue (y), Ksh ‘000’ |
|---|---|
| 21 | 136 |
| 28 | 158 |
| 22 | 145 |
| 30 | 162 |
| 26 | 149 |
| 25 | 150 |
- (i) Determine the regression equation y on x.
- (ii) Using the equation in (i) above, estimate the sales revenue when the advertising cost is 30,000.
(12 marks)
Answer
(i) Regression of sales revenue on advertising costs
| x: advertising costs (Ksh ‘000’) | y: sales revenue (Ksh ‘000’) | x² | xy |
|---|---|---|---|
| 21 | 136 | 441 | 2,856 |
| 28 | 158 | 784 | 4,424 |
| 22 | 145 | 484 | 3,190 |
| 30 | 162 | 900 | 4,860 |
| 26 | 149 | 676 | 3,874 |
| 25 | 150 | 625 | 3,750 |
| 152 | 900 | 3,910 | 22,954 |
| Step | Working |
|---|---|
| Number of observations | n = 6 |
| Slope b | [nΣxy − (Σx)(Σy)] / [nΣx² − (Σx)²] |
| Substitute | [6(22,954) − 152(900)] / [6(3,910) − (152)²] = 2.595506 |
| Intercept a | ȳ − bx̄ = 150 − (2.595506)(25.333333) = 84.247191 |
| Regression equation | ŷ = 84.247191 + 2.595506x |
(ii) Estimate at Ksh 30,000
| Step | Working |
|---|---|
| Convert advertising cost to table units | x = 30,000/1,000 = 30 |
| Substitute | ŷ = 84.247191 + 2.595506(30) = 162.11236 thousand shillings |
| Estimated sales revenue | Ksh 162,112.36 |
Question 2(a)
The following information relates to scores awarded to 655 sales persons based on their performance.
| Scores | Number of sales persons |
|---|---|
| 0–5 | 29 |
| 5–10 | 195 |
| 10–15 | 241 |
| 15–20 | 117 |
| 20–25 | 52 |
| 25–30 | 10 |
| 30–35 | 6 |
| 35–40 | 3 |
| 40–45 | 2 |
Calculate the:
- (i) median score;
- (ii) lower quartile;
- (iii) upper quartile;
- (iv) 90th percentile.
(12 marks)
Answer
| Scores | Frequency f | Cumulative frequency |
|---|---|---|
| 0–5 | 29 | 29 |
| 5–10 | 195 | 224 |
| 10–15 | 241 | 465 |
| 15–20 | 117 | 582 |
| 20–25 | 52 | 634 |
| 25–30 | 10 | 644 |
| 30–35 | 6 | 650 |
| 35–40 | 3 | 653 |
| 40–45 | 2 | 655 |
N = 655 and class width h = 5. The adjoining intervals are treated as continuous: a class 5–10 means 5 ≤ score < 10. No 0.5 adjustment is applied.
Grouped quantile = L + [(target position − cumulative frequency before the class)/class frequency] × h.
| Measure | Target position | Working | Estimated score |
|---|---|---|---|
| (i) Median | 327.5 | 10 + [(327.5 − 224)/241] × 5 | 12.1473 |
| (ii) Q₁ | 163.75 | 5 + [(163.75 − 29)/195] × 5 | 8.4551 |
| (iii) Q₃ | 491.25 | 15 + [(491.25 − 465)/117] × 5 | 16.1218 |
| (iv) P₉₀ | 589.5 | 20 + [(589.5 − 582)/52] × 5 | 20.7212 |
Question 2(b)
A market survey of 250 residents of Maputo town revealed that they read the following newspapers:
- 130 read the National Newspaper;
- 70 read the Sunlight Newspaper;
- 140 read the Times Newspaper;
- 80 read Times and National Newspapers;
- 30 read National and Sunlight Newspapers;
- 30 read Sunlight and Times Newspapers;
- 20 read all the three newspapers.
- (i) Present the information above in a Venn diagram.
- (ii) Calculate the probability that a resident chosen at random reads only one of the newspapers.
(8 marks)
Answer
(i) Venn diagram
| Region | Working | Residents |
|---|---|---|
| All three | Given | 20 |
| National and Sunlight only | 30 − 20 | 10 |
| National and Times only | 80 − 20 | 60 |
| Sunlight and Times only | 30 − 20 | 10 |
| National only | 130 − 10 − 60 − 20 | 40 |
| Sunlight only | 70 − 10 − 10 − 20 | 30 |
| Times only | 140 − 60 − 10 − 20 | 50 |
| At least one | 40 + 30 + 50 + 10 + 60 + 10 + 20 | 220 |
| None | 250 − 220 | 30 |
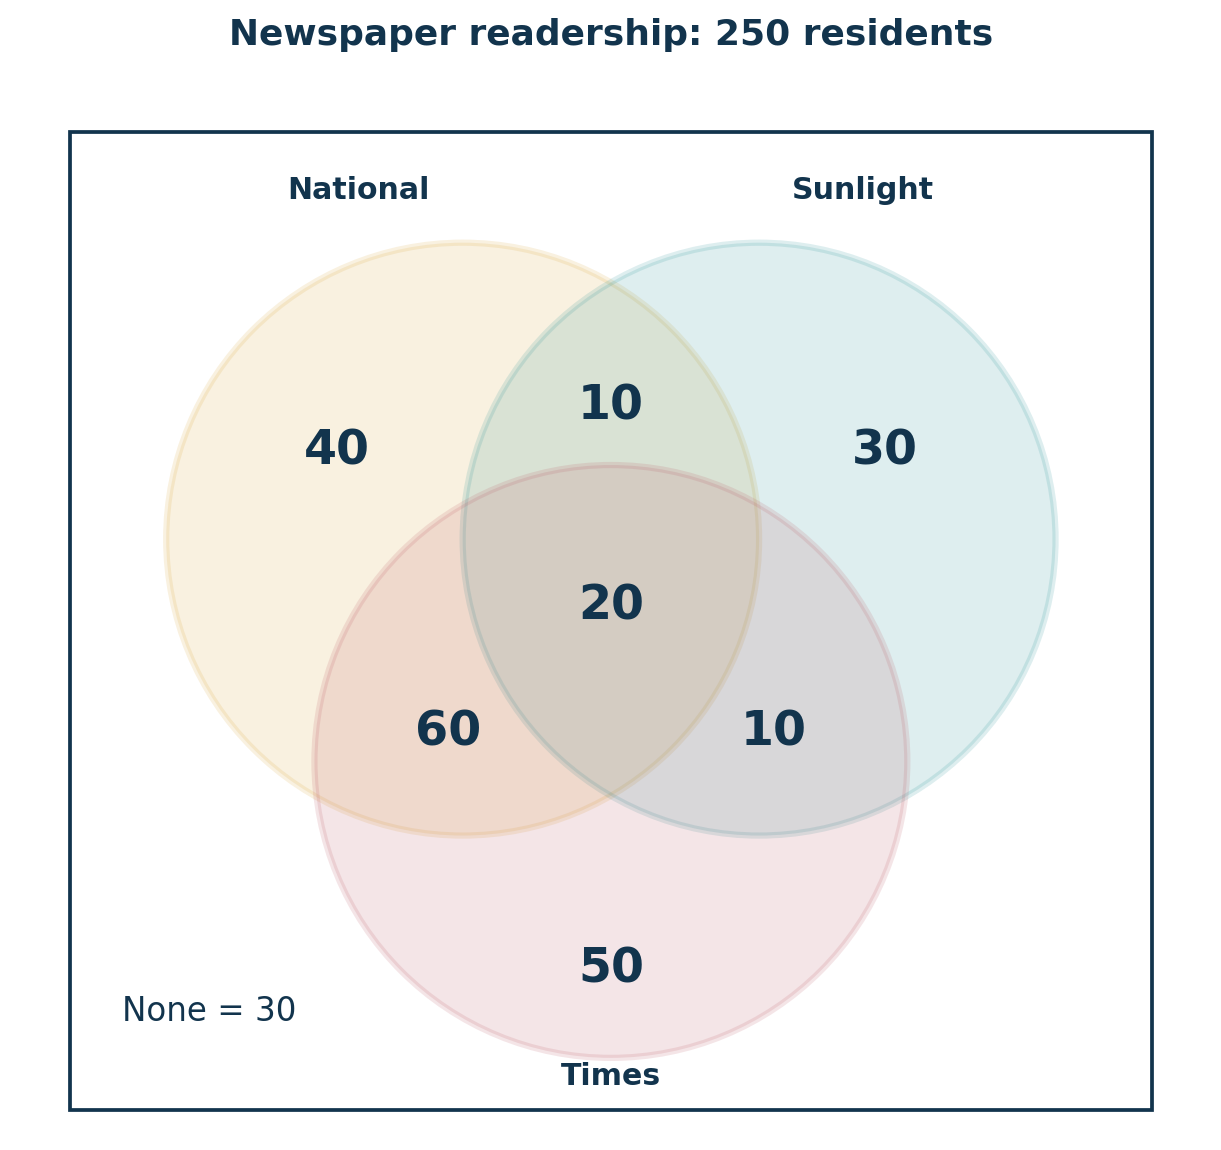
(ii) Reads only one newspaper
| Step | Working |
|---|---|
| Exactly one | 40 + 30 + 50 = 120 residents |
| Probability | 120/250 = 12/25 = 0.48 |
Question 3(a)
The following are the prices and quantities of three commodities in the years 2010 and 2017.
| Commodity | 2010: Price (Ksh) | 2010: Quantity (kg) | 2017: Price (Ksh) | 2017: Quantity (kg) |
|---|---|---|---|---|
| Rice | 60 | 1 | 170 | 2 |
| Sugar | 140 | 2 | 200 | 2 |
| Maize flour | 240 | 4 | 450 | 5 |
(i) Calculate the:
- (I) Paasche’s quantity index;
- (II) Laspeyre’s quantity index;
- (III) Fisher’s ideal quantity index.
(ii) Interpret the result in (III) above.
(12 marks)
Answer
Take 2010 as the base year: p₀, q₀ are base prices and quantities; p₁, q₁ are 2017 prices and quantities.
| Commodity | p₀q₀ | p₀q₁ | p₁q₀ | p₁q₁ |
|---|---|---|---|---|
| Rice | 60 | 120 | 170 | 340 |
| Sugar | 280 | 280 | 400 | 400 |
| Maize flour | 960 | 1200 | 1800 | 2250 |
| Total | 1300 | 1600 | 2370 | 2990 |
| Index | Formula and substitution | Result (2010 = 100) |
|---|---|---|
| (i)(I) Paasche quantity index | QP = (Σp₁q₁/Σp₁q₀) × 100 = (2,990/2,370) × 100 | 126.1603 |
| (i)(II) Laspeyres quantity index | QL = (Σp₀q₁/Σp₀q₀) × 100 = (1,600/1,300) × 100 | 123.0769 |
| (i)(III) Fisher ideal quantity index | QF = √(QL × QP) | 124.6091 |
(ii) Fisher’s index is 124.6091. The weighted aggregate quantity in 2017 was approximately 24.61% higher than in 2010.
Question 3(b)
The following data shows the total annual wages paid to employees of Mulika County for a period of ten consecutive years.
| Year | Annual wages (Ksh millions) |
|---|---|
| 2008 | 148 |
| 2009 | 156 |
| 2010 | 160 |
| 2011 | 169 |
| 2012 | 176 |
| 2013 | 190 |
| 2014 | 202 |
| 2015 | 208 |
| 2016 | 216 |
| 2017 | 228 |
- (i) Using the least squares method, determine the trend line equation.
- (ii) Using the equation in (i) above, estimate the annual wages in the year 2020.
(8 marks)
Answer
(i) Least-squares trend
Code time as t = year − 2012.5 so that Σt = 0. In the regression working, x represents this time code t.
| t = year − 2012.5 | Y: wages (Ksh millions) | x² | xy |
|---|---|---|---|
| -4.5 | 148 | 20.25 | -666 |
| -3.5 | 156 | 12.25 | -546 |
| -2.5 | 160 | 6.25 | -400 |
| -1.5 | 169 | 2.25 | -253.5 |
| -0.5 | 176 | 0.25 | -88 |
| 0.5 | 190 | 0.25 | 95 |
| 1.5 | 202 | 2.25 | 303 |
| 2.5 | 208 | 6.25 | 520 |
| 3.5 | 216 | 12.25 | 756 |
| 4.5 | 228 | 20.25 | 1,026 |
| 0 | 1,853 | 82.5 | 746.5 |
| Step | Working |
|---|---|
| Number of observations | n = 10 |
| Slope b | [nΣxy − (Σx)(Σy)] / [nΣx² − (Σx)²] |
| Substitute | [10(746.5) − 0(1,853)] / [10(82.5) − (0)²] = 9.048485 |
| Intercept a | ȳ − bx̄ = 185.3 − (9.048485)(0) = 185.3 |
| Regression equation | ŷ = 185.3 + 9.048485x |
Trend equation: Ŷ = 185.3 + 9.048485t, where t = year − 2012.5 and Ŷ is in Ksh millions.
(ii) Forecast for 2020
| Step | Working |
|---|---|
| Time code | t = 2020 − 2012.5 = 7.5 |
| Forecast | Ŷ = 185.3 + 9.048485(7.5) = 253.163636 million |
| Annual wages | Approximately Ksh 253,163,636.36 |
Question 4(a)
The following information relates to a project that is to be undertaken by Malip Limited.
| Activity | Preceeding activity | Duration (days) |
|---|---|---|
| A | — | 6 |
| B | A | 9 |
| C | A | 15 |
| D | B | 24 |
| E | B | 18 |
| F | C | 3 |
| G | C | 6 |
| H | C, D | 9 |
| I | E, F | 21 |
| J | G, H | 12 |
| K | I, J | 15 |
- (i) Draw a network diagram of the project.
- (ii) Determine the: (I) critical path; (II) project duration.
(12 marks)
Answer
(i) Network diagram
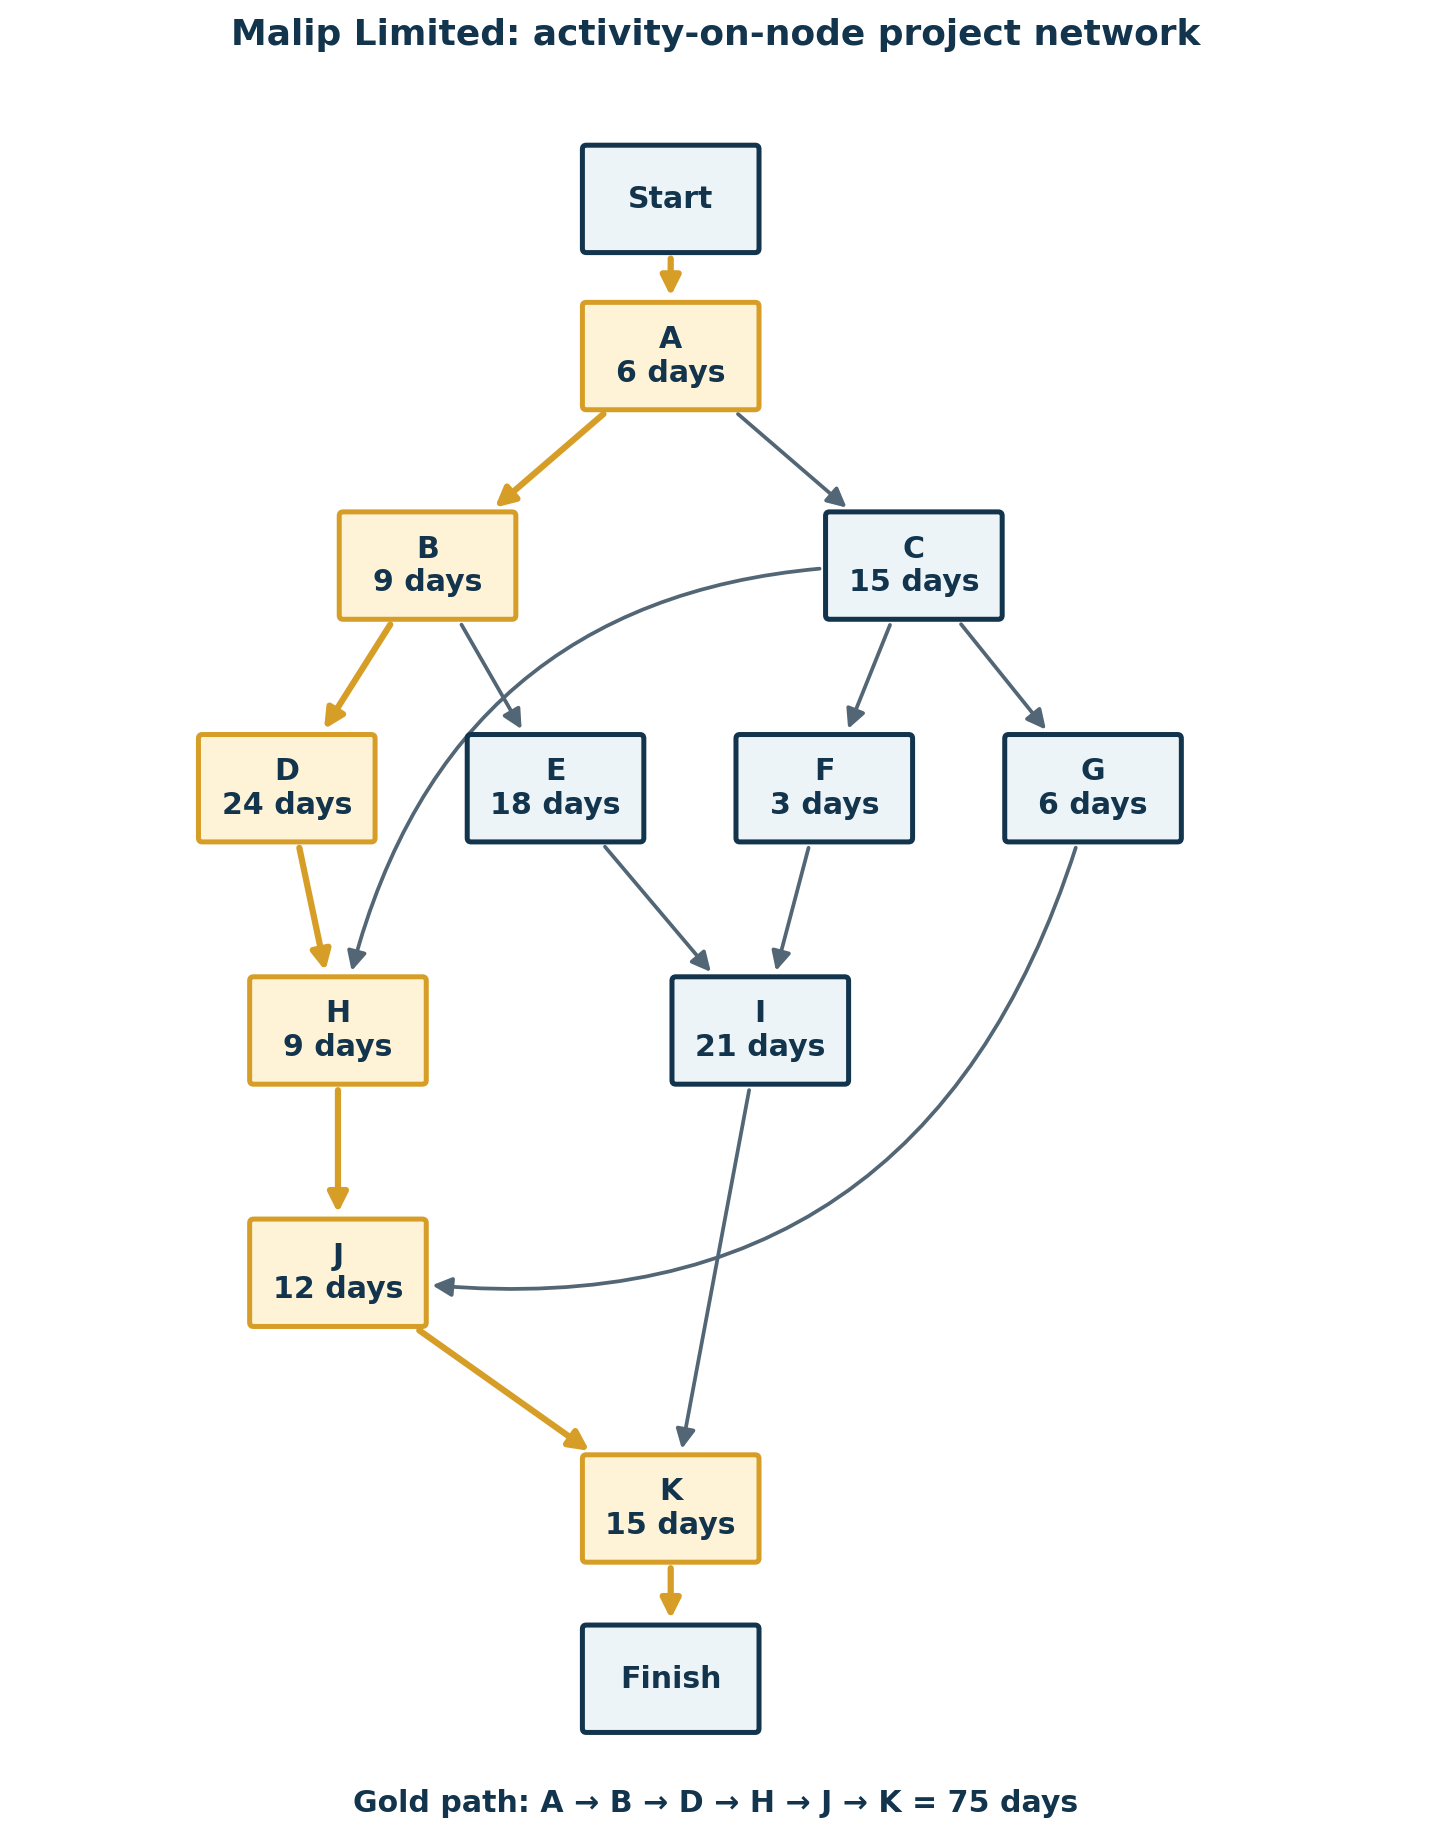
Every arrow represents a stated precedence requirement. H waits for both C and D; I waits for E and F; J waits for G and H; K waits for I and J.
(ii) Critical path and duration
Forward pass: earliest start is the latest finish of the predecessors; earliest finish = earliest start + duration. Backward pass: latest finish is the earliest latest start of the successors; latest start = latest finish − duration. Total float = latest start − earliest start.
| Activity | Duration | Earliest start | Earliest finish | Latest start | Latest finish | Total float |
|---|---|---|---|---|---|---|
| A | 6 | 0 | 6 | 0 | 6 | 0 |
| B | 9 | 6 | 15 | 6 | 15 | 0 |
| C | 15 | 6 | 21 | 21 | 36 | 15 |
| D | 24 | 15 | 39 | 15 | 39 | 0 |
| E | 18 | 15 | 33 | 21 | 39 | 6 |
| F | 3 | 21 | 24 | 36 | 39 | 15 |
| G | 6 | 21 | 27 | 42 | 48 | 21 |
| H | 9 | 39 | 48 | 39 | 48 | 0 |
| I | 21 | 33 | 54 | 39 | 60 | 6 |
| J | 12 | 48 | 60 | 48 | 60 | 0 |
| K | 15 | 60 | 75 | 60 | 75 | 0 |
| Result | Answer |
|---|---|
| (I) Critical path | A → B → D → H → J → K |
| (II) Project duration | 6 + 9 + 24 + 9 + 12 + 15 = 75 days |
Question 4(b)
Ms Jane plans to purchase a photocopying machine in 3 years time. The machine is expected to cost Ksh 250,000. In order to purchase the machine, Jane intends to deposit Ksh 100,000 in a savings account at the beginning of the first year and Ksh 60,000 at the beginning of the second year. The account pays compound at the rate of 10% per annum.
Calculate the amount that Jane should deposit into the savings account at the beginning of the third year in order to purchase the machine. (8 marks)
Answer
Use the purchase date, the end of year 3, as the common valuation date. The three deposits earn interest for 3, 2 and 1 years respectively.
| Deposit | Years earning interest | Value at purchase date (Ksh) |
|---|---|---|
| Beginning of year 1 | 3 | 100,000(1.10)³ = 133,100 |
| Beginning of year 2 | 2 | 60,000(1.10)² = 72,600 |
| Beginning of year 3 | 1 | X(1.10) |
| Step | Working |
|---|---|
| Future-value equation | 133,100 + 72,600 + 1.10X = 250,000 |
| Amount still required at purchase | 1.10X = 250,000 − 205,700 = 44,300 |
| Third deposit | X = 44,300/1.10 = Ksh 40,272.73 |
Question 5(a)
The following is a distribution of marks awarded to 210 employees of Moffat Limited based on their performance.
| Marks | Number of Employees |
|---|---|
| 5–10 | 10 |
| 10–15 | 20 |
| 15–20 | 27 |
| 20–25 | 36 |
| 25–30 | 52 |
| 30–35 | 42 |
| 35–40 | 18 |
| 40–45 | 5 |
Calculate the:
- (i) standard deviation;
- (ii) interquartile range;
- (iii) mean deviation.
(12 marks)
Answer
Use class midpoints x and N = 210. These are grouped-data estimates. Use the population denominator N for the described distribution.
| Class / value | f | x | fx | fx² | f|x − mean| |
|---|---|---|---|---|---|
| 5–10 | 10 | 7.5 | 75 | 562.5 | 176.9048 |
| 10–15 | 20 | 12.5 | 250 | 3,125 | 253.8095 |
| 15–20 | 27 | 17.5 | 472.5 | 8,268.75 | 207.6429 |
| 20–25 | 36 | 22.5 | 810 | 18,225 | 96.8571 |
| 25–30 | 52 | 27.5 | 1,430 | 39,325 | 120.0952 |
| 30–35 | 42 | 32.5 | 1,365 | 44,362.5 | 307 |
| 35–40 | 18 | 37.5 | 675 | 25,312.5 | 221.5714 |
| 40–45 | 5 | 42.5 | 212.5 | 9,031.25 | 86.5476 |
| Total | 210 | — | 5,290 | 148,212.5 | 1,470.4286 |
(i) Standard deviation
| Step | Working |
|---|---|
| Mean | x̄ = Σfx/N = 5,290/210 = 25.190476 |
| Variance | σ² = Σfx²/N − x̄² = 148,212.5/210 − (5,290/210)² = 71.213719 |
| Standard deviation | σ = √71.213719 = 8.4388 marks |
(ii) Interquartile range
| Measure | Working | Result |
|---|---|---|
| Q₁ | 15 + [(52.5 − 30)/27] × 5 | 19.1667 |
| Q₃ | 30 + [(157.5 − 145)/42] × 5 | 31.4881 |
| IQR | Q₃ − Q₁ | 12.3214 marks |
For Q₁ the cumulative frequency before 15–20 is 30; for Q₃ it is 145 before 30–35. The class width is 5.
(iii) Mean deviation about the arithmetic mean
| Formula | Substitution | Answer |
|---|---|---|
| MD = Σf|x − x̄|/N | 1,470.428571/210 | 7.002 marks |
Question 5(b)
Determine the derivatives of each of the following functions:
- (i) y = 5x² − 2x + 4
- (ii) y = 12 − 10x + 6x² − 2x³
- (iii) y = 5x⁴ − 2x³ + 5x² + 10x − 12
- (iv) y = 3x² − 2x + 4
(8 marks)
Answer
Apply the power rule d(axⁿ)/dx = anxⁿ⁻¹. A constant differentiates to zero.
| Part | Differentiate term by term | dy/dx |
|---|---|---|
| (i) | 10x − 2 + 0 | 10x − 2 |
| (ii) | 0 − 10 + 12x − 6x² | −10 + 12x − 6x² |
| (iii) | 20x³ − 6x² + 10x + 10 − 0 | 20x³ − 6x² + 10x + 10 |
| (iv) | 6x − 2 + 0 | 6x − 2 |
Question 6(a)
Explain five roles of quantitative techniques in business decision making. (10 marks)
Answer
- Forecasting: use historical sales, demand or cost data to estimate future outcomes and support planning.
- Resource allocation: determine how limited labour, funds, materials or machine time can be assigned to competing activities.
- Comparing investments and alternatives: calculate expected returns, present values or decision payoffs using consistent criteria.
- Operational control: use inventory, scheduling, quality-control and queueing models to reduce delays, shortages and waste.
- Managing uncertainty: quantify probabilities and risks, test scenarios and assess how decisions respond to changing assumptions.
Question 6(b)
The following data shows the output (in tonnes) of Pandia Limited for a period of 30 working days.
| 1 | 2 | 3 | 4 | 5 | 6 |
|---|---|---|---|---|---|
| 04 | 28 | 32 | 38 | 05 | 10 |
| 05 | 10 | 16 | 22 | 20 | 18 |
| 07 | 12 | 20 | 31 | 30 | 20 |
| 40 | 27 | 03 | 45 | 41 | 42 |
| 45 | 08 | 12 | 18 | 48 | 09 |
- (i) Construct a frequency distribution table starting with the classes 0–10, 10–20, …
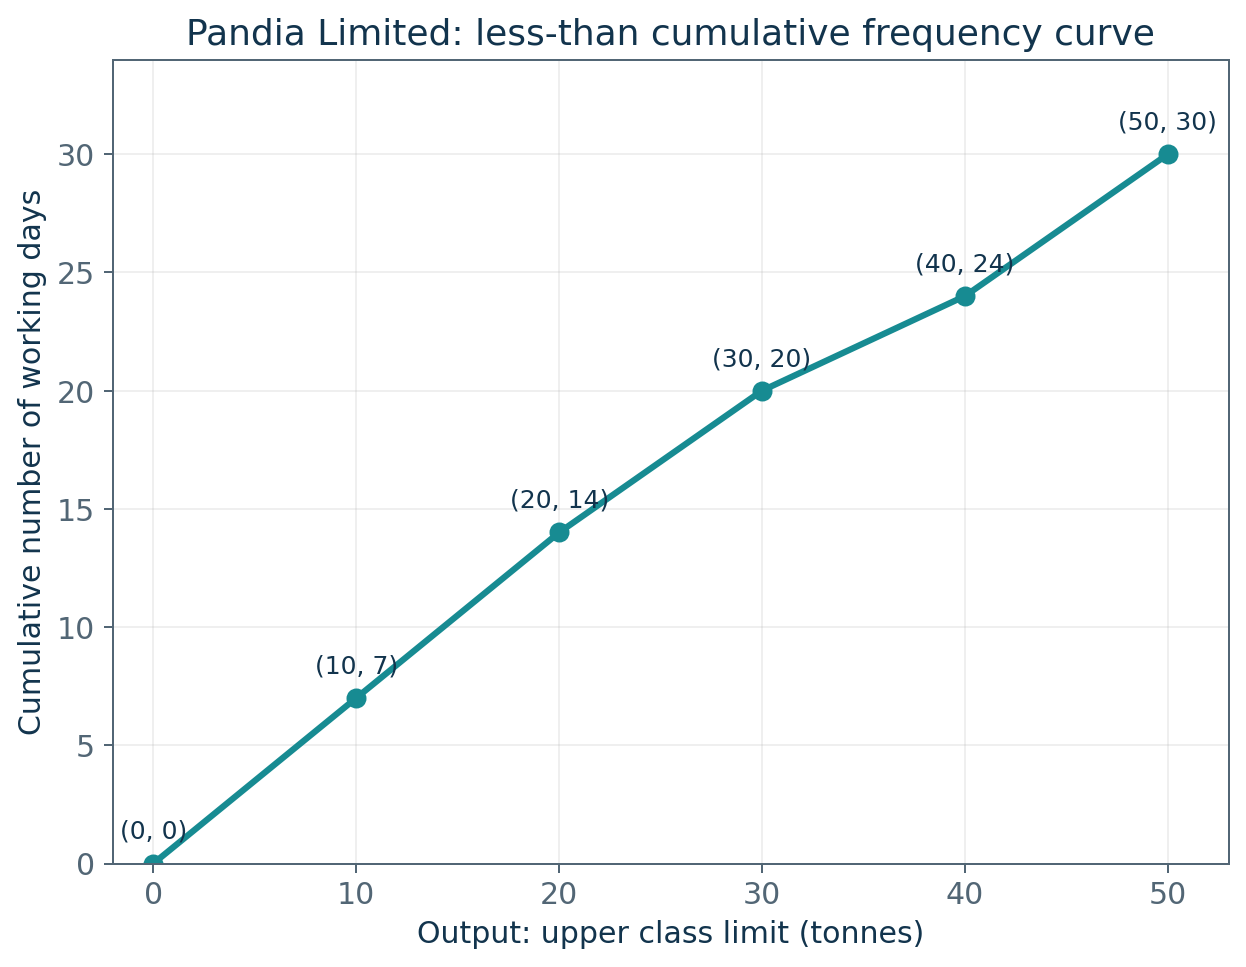
- (ii) Using the table in (i) above, plot a cumulative frequency curve.
(10 marks)
Answer
(i) Frequency distribution
Use non-overlapping classes: 0–10 means 0 ≤ output < 10; 10–20 means 10 ≤ output < 20, and so on. A value exactly 10 belongs in 10–20.
| Output (tonnes) | Frequency | Less-than cumulative frequency |
|---|---|---|
| 0–10 | 7 | 7 |
| 10–20 | 7 | 14 |
| 20–30 | 6 | 20 |
| 30–40 | 4 | 24 |
| 40–50 | 6 | 30 |
The frequencies total 30 working days.
(ii) Less-than cumulative frequency curve
Plot the upper class limits against cumulative frequencies, including the starting point (0, 0): (10, 7), (20, 14), (30, 20), (40, 24), (50, 30). Join consecutive points to form the ogive.
Question 7(a)
Explain the meaning of each of the following terms as used in sampling theory:
- (i) sampling design;
- (ii) sampling frame;
- (iii) sampling bias;
- (iv) statistic.
(8 marks)
Answer
| Term | Meaning |
|---|---|
| (i) Sampling design | The plan specifying the target population, sampling units and method used to select a sample. It includes how selection will be carried out and the intended sample size. |
| (ii) Sampling frame | The list or operational representation of population units from which a sample is actually selected, such as a current register of all eligible employees. |
| (iii) Sampling bias | A systematic distortion caused by the sampling or selection process, so that some population members are inadequately represented. Increasing the sample size alone does not remove it. |
| (iv) Statistic | A numerical summary calculated from sample observations, such as a sample mean or proportion. It may be used to estimate a population parameter. |
Question 7(b)
A company has three alternative investments, X, Y and Z. The payoffs from each of those investments will be determined by four possible events; A, B, C and D.
The following table shows the payoffs from each of the three alternative investments.
| Alternative | A (Ksh) | B (Ksh) | C (Ksh) | D (Ksh) |
|---|---|---|---|---|
| X | 10,000 | 2,000 | -8,000 | 8,000 |
| Y | -2,000 | 16,000 | 20,000 | 0 |
| X | 16,000 | 8,000 | 3,000 | 10,000 |
Advise the management on the investment to choose based on:
- (i) maximin criterion;
- (ii) maximax criterion;
- (iii) minimax regret criterion.
(12 marks)
Answer
Source note: the question names X, Y and Z, but the printed table repeats X on its third row. In this answer, Z denotes that third row, following the alternatives named in the question. No payoff is changed.
(i) Maximin criterion
Find the minimum payoff for each investment, then choose the greatest minimum.
| Investment | Minimum payoff (Ksh) |
|---|---|
| X | -8,000 |
| Y | -2,000 |
| Z | 3,000 |
Choose Z: its minimum payoff is Ksh 3,000, the highest of the three minimums.
(ii) Maximax criterion
Find the maximum payoff for each investment, then choose the greatest maximum.
| Investment | Maximum payoff (Ksh) |
|---|---|
| X | 10,000 |
| Y | 20,000 |
| Z | 16,000 |
Choose Y: it offers the highest possible payoff, Ksh 20,000.
(iii) Minimax regret criterion
For each event, regret = the best payoff available under that event minus the investment’s payoff. The best event payoffs are A: 16,000; B: 16,000; C: 20,000; D: 10,000.
| Investment | Regret A | Regret B | Regret C | Regret D | Maximum regret (Ksh) |
|---|---|---|---|---|---|
| X | 6,000 | 14,000 | 28,000 | 2,000 | 28,000 |
| Y | 18,000 | 0 | 0 | 10,000 | 18,000 |
| Z | 0 | 8,000 | 17,000 | 0 | 17,000 |
Choose Z: its maximum regret of Ksh 17,000 is smaller than Y’s Ksh 18,000 and X’s Ksh 28,000. These rules use different attitudes to uncertainty; no event probabilities are supplied.