KNEC Diploma in Supply Chain Management, Module II. Original theory examination questions with explained model answers for revision.
July 2023
Paper codes: 2903/204 Time: 3 hours Instructions: Answer any FIVE questions. All questions carry equal marks. Answer the questions in English.
Question 1(a) — 10 marks
Explain five requirements of a linear programming problem.
Model answer
An explicit objective must be specified, such as maximizing profit or minimizing cost, expressed as a linear function of the decision variables.
Clearly defined decision variables represent the quantities the business can choose.
Resource limits or business requirements must be expressible as linear equality or inequality constraints.
Relationships must be proportional and additive: coefficients remain constant, with no products or powers of decision variables; continuous divisibility is assumed unless integer restrictions are added.
Coefficients are treated as known with certainty and feasible sign restrictions, normally non-negativity, must be specified so the solution has business meaning.
Question 1(b) — 10 marks
The following information relates to ten machines at Okwot Enterprises.
Age of machine (years)
Annual maintenance cost Ksh 000
12
60
8
52
10
55
4
30
7
40
2
20
11
58
10
54
10
50
15
70
(i) Calculate the Pearson’s correlation co-efficient.
(ii) Interpret the results in (i) above.
Model answer
Let x be age and y be annual maintenance cost in Ksh thousands. n = 10.
There is a strong positive linear association: older machines tend to have higher annual maintenance costs. Correlation alone does not establish that age is the only cause of the cost difference.
Question 2(a) — 10 marks
Explain five roles of quantitative techniques in business decision making.
Model answer
Forecasting demand and sales from data helps determine future production, purchasing and staffing requirements.
Optimisation allocates scarce labour, materials and machine time to the activities that best meet a stated objective.
Inventory models balance ordering, holding and shortage costs to guide replenishment decisions.
Project scheduling identifies activity dependencies, completion times and critical tasks so managers can control delivery.
Probability and statistical analysis measure uncertainty, compare alternatives and test claims, supporting more consistent risk-informed decisions.
Question 2(b) — 10 marks
The total cost of one pencil and one eraser in a shop is Ksh 70. The total cost of three similar pencils exceeds the total cost of two similar erasers by Ksh 110.
(i) Formulate simultaneous equations from the information above.
(ii) Using matrix method, solve the simultaneous equations in (i) above to determine the cost of each item.
(iii) Determine the total cost of five pencils and eight erasers.
Model answer
Let x = pencil price and y = eraser price. Then x + y = 70 and 3x − 2y = 110. In matrix form AX = b, with A =
1
1
3
-2
and b =
70
110
det A = −2 − 3 = −5; A⁻¹ = (−1/5)
-2
-1
-3
1
X = A⁻¹b = (−1/5)[−140−110, −210+110]ᵀ = [50,20]ᵀ.
Step / item
Working
Result
Pencil price
x
50
Eraser price
y
20
Five pencils and eight erasers
5×50 + 8×20
410
Check: 50 + 20 = 70; 3×50 − 2×20 = 110.
Question 3(a) — 10 marks
Explain the importance of Time Series analysis in decision making.
Model answer
It reveals the long-term trend in sales, costs or demand, helping managers plan growth and capacity.
It identifies seasonal patterns so purchasing, staffing and cash availability can be adjusted before predictable peaks and troughs.
It supports forecasts based on observed historical movement, providing inputs for budgets and operating plans.
It separates regular patterns from unusual movements, helping managers investigate shocks or changes in performance.
It provides a benchmark for comparing actual results with expected patterns and assessing whether corrective action is needed.
Question 3(b) — 10 marks
The following is the Marginal Revenue (MR) function of a firm.
MR = 20 − 0.5q
Where q is the level of output sold by the firm. Determine the:
(i) total revenue function;
(ii) level of output that will maximize the total revenue;
(iii) maximum total revenue;
(iv) price at maximum total revenue.
Model answer
Step
Working
Integrate marginal revenue
TR = ∫(20 − 0.5q)dq = 20q − 0.25q² + C
Boundary condition
TR(0)=0 ⇒ C=0, so TR=20q−0.25q²
Maximising output
dTR/dq = MR = 20 − 0.5q = 0 ⇒ q=40 units
Second derivative
d²TR/dq² = −0.5 < 0, confirming a maximum
Maximum total revenue
TR(40)=800−400=400 monetary units
Price at that output
P=TR/q=400/40=10 monetary units per unit
Question 4(a) — 8 marks
Explain four problems that may be encountered when constructing index numbers.
Model answer
Selecting a representative base year is difficult when available years contain unusual inflation, shortages or other shocks.
Choosing representative commodities and obtaining comparable prices can be difficult because consumption differs among households and locations.
Selecting suitable weights is challenging, and old weights become misleading as expenditure patterns change.
Quality changes, new products, disappearing products and different units of sale reduce comparability over time and may require adjustments.
Question 4(b) — 12 marks
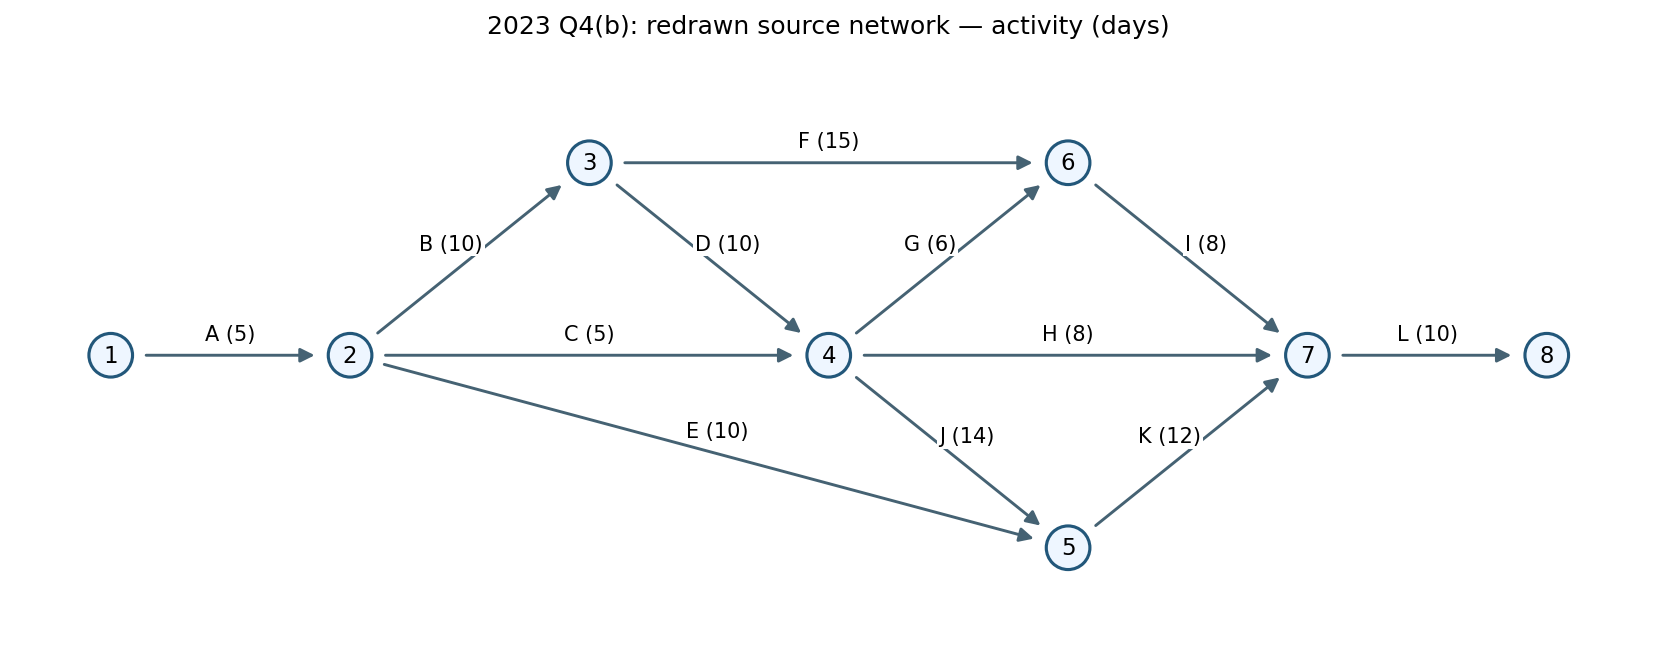
Figure 1 is a network diagram of a project to be undertaken by a firm. The time duration is given in days.
(i) Prepare a table showing the activity, preceding activity and the duration.
(ii) Determine the: (I) critical path; (II) project duration.
Model answer
The event numbers are added to the redrawing for reference; activity labels and durations retain the supplied network. An activity leaving a merge event waits for all activities entering that event.
Activity
Preceding activities
Duration days
ES
EF
LS
LF
Float
A
—
5
0
5
0
5
0
B
A
10
5
15
5
15
0
C
A
5
5
10
20
25
15
D
B
10
15
25
15
25
0
E
A
10
5
15
29
39
24
F
B
15
15
30
28
43
13
G
C,D
6
25
31
37
43
12
H
C,D
8
25
33
43
51
18
I
F,G
8
31
39
43
51
12
J
C,D
14
25
39
25
39
0
K
E,J
12
39
51
39
51
0
L
H,I,K
10
51
61
51
61
0
Forward pass: take the maximum finish of all predecessors. Backward pass: take the minimum start of successors. The zero-float path is A → B → D → J → K → L, taking 5 + 10 + 10 + 14 + 12 + 10 = 61 days.
Question 5(a) — 8 marks
Explain four poor stock management practices that may make a firm to accumulate high levels of stock.
Model answer
Ordering quantities beyond realistic demand or buying merely to obtain discounts creates excess inventory and ties up cash.
Poor or outdated demand forecasting causes purchases to continue after demand has fallen or product preferences have changed.
Inaccurate stock records and weak coordination allow duplicate orders for stock already held or on order.
Failure to review slow-moving and obsolete stock, enforce reorder limits or dispose of unwanted items allows old stock to accumulate.
Question 5(b) — 12 marks
The following are prices and quantities of four commodities in a market for the years 2015 and 2018.
Distinguish between each of the following terms as used in the test of hypothesis: (i) Type I error and Type II error; (ii) critical region and acceptance region; (iii) Z-test and T-test.
Model answer
Pair
First term
Second term
Type I / Type II error
Type I: reject a true H₀. Its probability is α, the significance level.
Type II: fail to reject a false H₀. Its probability is β; power is 1−β.
Critical / acceptance region
Critical region contains test-statistic values leading to rejection of H₀ at the chosen α.
The non-rejection region contains values for which evidence is insufficient to reject H₀; it does not prove H₀.
Z-test / t-test
A Z-test uses the standard normal distribution, e.g. a mean test with known population standard deviation or a suitable large-sample approximation.
A one-sample t-test for a mean uses sample standard deviation when population σ is unknown, with n−1 degrees of freedom and appropriate normality/independence assumptions. The t distribution has heavier tails, especially for small samples.
Question 6(b) — 8 marks
John intends to invest Ksh 3,000,000 for a period of five years in either option A or option B.
Option A: deposit the amount in an account paying interest at the rate of 10% per annum compounded semi-annually.
Option B: invest the amount in a fund paying interest at the rate of 8% per annum compounded quarterly.
(i) Determine the total amount that will be available to John under each option at the end of five years.
(ii) Calculate the interest that will be earned under each option.
(iii) Based on the results in (ii) above, advise John on the option to invest in.
Model answer
Compound amount F = P(1 + r/m)ᵐᵗ. Interest = F − P.
Option
Periodic rate
Periods
Future amount Ksh
Interest Ksh
A
10%/2 = 5%
10
4,886,683.88
1,886,683.88
B
8%/4 = 2%
20
4,457,842.19
1,457,842.19
On the rates given and assuming equal risk, charges and access conditions, choose A: it earns Ksh 428,841.69 more over five years. This is the comparison requested by the examination data.
Question 7(a) — 10 marks
In the “Jua Kali” sector, the percentage of male entrepreneurs is 70%. A random sample of ten entrepreneurs was selected from the sector. Determine the probability of selecting:
(i) one male entrepreneur;
(ii) no male entrepreneur;
(iii) at least one male entrepreneur;
(iv) at most eight male entrepreneurs.
Model answer
Let X ~ Binomial(10,0.7), assuming independent selections with constant probability. P(X=k)=C(10,k)0.7ᵏ0.3¹⁰⁻ᵏ.
Part
Working
Probability
(i)
10×0.7×0.3⁹
0.000137781
(ii)
0.3¹⁰
0.000005905
(iii)
1−0.3¹⁰
0.999994095
(iv)
1−[10×0.7⁹×0.3 + 0.7¹⁰]
0.850691654
Question 7(b) — 10 marks
The following are the sales of a company for ten consecutive years.
Year
Sales Ksh million
2000
40
2001
38
2002
42
2003
50
2004
48
2005
52
2006
65
2007
65
2008
70
2009
72
(i) Using three year moving averages, determine the trend values.
(ii) Comment on the trend in the sales.
Model answer
Average each consecutive group of three years and place the result against the middle year.
Centred year
Window
Three-year total
Moving average Ksh million
2001
2000–2002
120
40
2002
2001–2003
130
43.33
2003
2002–2004
140
46.67
2004
2003–2005
150
50
2005
2004–2006
165
55
2006
2005–2007
182
60.67
2007
2006–2008
200
66.67
2008
2007–2009
207
69
The smoothed sales trend rises from Ksh 40.00 million in 2001 to Ksh 69.00 million in 2008, with faster growth in the later years. There is no centred three-year value for 2000 or 2009 because an adjoining year is missing at each end.
Finish Course Early?
You have not completed all required lessons and assessments.