Quantitative Techniques — 2021
KNEC Diploma in Supply Chain Management, Module II. Original theory examination questions with explained model answers for revision.
July 2021
Paper codes: 2903/204
Time: Not shown in supplied scan
Instructions: Not shown in supplied scan
Question 1(a) — 12 marks
The following are the revenue (R) function and cost (C) function of PT suppliers.
R=36Q+Q²
C=5Q²−4Q−90Where Q is the number of units produced and sold. Calculate the: (i) quantity to be sold in order to maximize profit; (ii) price at which profit will be maximized; (iii) maximum profit.
Model answer
| Step | Working |
|---|---|
| Profit function | π=R−C=40Q−4Q²+90 |
| Maximum condition | dπ/dQ=40−8Q=0 ⇒ Q=5 units |
| Second derivative | d²π/dQ²=−8<0 |
| Price | R/Q=36+Q=41 monetary units |
| Maximum profit | π(5)=200−100+90=190 monetary units |
The supplied negative constant in the cost function is retained as printed.
Question 1(b) — 8 marks
Wema Enterprises buys and sells product W. Its annual demand is 5,000 units. The ordering cost is Ksh 25,000 per order. The cost price per unit is Ksh 400. Annual carrying cost per unit is 10% of the cost price. Calculate the: (i) EOQ; (ii) total relevant costs.
Model answer
| Step / item | Working | Result |
|---|---|---|
| Annual holding cost per unit | 10% × 400 | 40 |
| EOQ | √(2×5,000×25,000/40) | 2,500 |
| Annual ordering cost | (5,000/2,500) × 25,000 | 50,000 |
| Annual holding cost | (2,500/2) × 40 | 50,000 |
| Total relevant annual cost | 50,000 + 50,000 | 100,000 |
The relevant EOQ cost is ordering plus holding cost; constant annual purchase expenditure is excluded from this decision cost.
Question 2(a) — 10 marks
The following information relates to material MM used by Pendo Manufacturers for the month of May 2016.
Item Value Maximum consumption 2,100 units per day Minimum consumption 9,100 units per day Maximum re-order period 4 days Minimum re-order period 2 days Re-order quantity 12,600 units Calculate the: (i) re-order level; (ii) maximum stock level; (iii) minimum stock level; (iv) average stock level.
Model answer
Source inconsistency: the printed minimum usage of 9,100 exceeds the maximum of 2,100. Normal usage and normal lead time are also not supplied. Consequently there is no valid, unique set of stock levels from these data.
| Required level | Formula / substitution |
|---|---|
| Reorder | Maximum usage × maximum lead time = 2,100×4 = 8,400 units, formally using the printed maximum. |
| Maximum stock | Reorder + order quantity − minimum usage×minimum lead time = 8,400+12,600−9,100×2 = 2,800 units; this is a formal substitution into inconsistent inputs, not a valid stock policy. |
| Minimum stock | 8,400 − normal daily usage × normal lead time; the normal values are missing. |
| Average stock | Minimum stock + 12,600/2 = minimum stock + 6,300. |
Even assuming midpoint values gives normal usage (2,100+9,100)/2=5,600 and lead time 3 days, implying minimum stock 8,400−16,800=−8,400, which confirms the data problem. A corrected minimum usage and a stated normal usage/lead-time convention are needed. No replacement figure is invented.
Question 2(b) — 10 marks
The following table shows the prices and quantities of three commodities for the years 2012 and 2016.
Commodity 2010 price Ksh 2010 quantity kg 2015 price Ksh 2015 quantity kg Maize 40 315 45 360 Beans 60 200 60 220 Potatoes 36 400 46 390 Calculate the: (i) Laspeyre’s quantity index; (ii) Paasche’s quantity index; (iii) Fisher’s ideal quantity index.
Model answer
The prose says 2012/2016 while the supplied column headings say 2010/2015. The first pair of columns is treated as the base period and the second as the current period; the numerical calculation is unaffected by this label conflict.
| Commodity | p₀q₀ | p₀q₁ | p₁q₀ | p₁q₁ |
|---|---|---|---|---|
| Maize | 12,600 | 14,400 | 14,175 | 16,200 |
| Beans | 12,000 | 13,200 | 12,000 | 13,200 |
| Potatoes | 14,400 | 14,040 | 18,400 | 17,940 |
| Total | 39,000 | 41,640 | 44,575 | 47,340 |
| Step / item | Working | Result |
|---|---|---|
| Laspeyres quantity index | 41,640/39,000 × 100 | 106.77 |
| Paasche quantity index | 47,340/44,575 × 100 | 106.20 |
| Fisher ideal quantity index | √(106.769231 × 106.203029) | 106.49 |
Question 3(a) — 10 marks
Fiki Enterprises manufactures product Dx. The following is the quarterly production in units for a period of three years.
Year Q1 units Q2 units Q3 units Q4 units 2014 320 300 380 480 2015 500 450 480 550 2016 580 570 600 630 Calculate: (i) 3-period moving averages; (ii) seasonal variations using additive method.
Model answer
Take the mean of each consecutive three-quarter window and centre it on the middle quarter. Additive residual = actual output − moving-average trend.
| Centred quarter | Actual output | 3-quarter total | 3-period MA | Actual − MA |
|---|---|---|---|---|
| 2014 Q2 | 300 | 1,000 | 333.33 | -33.33 |
| 2014 Q3 | 380 | 1,160 | 386.67 | -6.67 |
| 2014 Q4 | 480 | 1,360 | 453.33 | 26.67 |
| 2015 Q1 | 500 | 1,430 | 476.67 | 23.33 |
| 2015 Q2 | 450 | 1,430 | 476.67 | -26.67 |
| 2015 Q3 | 480 | 1,480 | 493.33 | -13.33 |
| 2015 Q4 | 550 | 1,610 | 536.67 | 13.33 |
| 2016 Q1 | 580 | 1,700 | 566.67 | 13.33 |
| 2016 Q2 | 570 | 1,750 | 583.33 | -13.33 |
| 2016 Q3 | 600 | 1,800 | 600 | 0 |
| Quarter | Sum of residuals | Number | Mean residual | Adjusted seasonal variation |
|---|---|---|---|---|
| Q1 | 36.67 | 2 | 18.33 | 16.53 |
| Q2 | -73.33 | 3 | -24.44 | -26.25 |
| Q3 | -20 | 3 | -6.67 | -8.47 |
| Q4 | 40.00 | 2 | 20.00 | 18.19 |
The four mean residuals sum to 7.222222; subtract their average, 1.805556, from each to make the additive seasonal effects sum to zero. The first and last quarters have no centred three-period average. A four-quarter seasonal cycle is usually smoothed using centred four-quarter averages, but the calculation above follows the question’s explicit three-period requirement.
Question 3(b) — 10 marks
The following information relates to a project to be undertaken by a firm.
Activity Preceding activities Duration days A — 2 B — 4 C A 5 D A 7 E B,D 1 F E 3 G C,F 4 H G 6 (i) Draw a network diagram of the project.
(ii) Determine the: (I) critical path; (II) project duration.
Model answer

| Activity | Predecessors | Duration | ES | EF | LS | LF | Float |
|---|---|---|---|---|---|---|---|
| A | — | 2 | 0 | 2 | 0 | 2 | 0 |
| B | — | 4 | 0 | 4 | 5 | 9 | 5 |
| C | A | 5 | 2 | 7 | 8 | 13 | 6 |
| D | A | 7 | 2 | 9 | 2 | 9 | 0 |
| E | B,D | 1 | 9 | 10 | 9 | 10 | 0 |
| F | E | 3 | 10 | 13 | 10 | 13 | 0 |
| G | C,F | 4 | 13 | 17 | 13 | 17 | 0 |
| H | G | 6 | 17 | 23 | 17 | 23 | 0 |
Forward pass: ES = latest predecessor EF; EF = ES + duration. Backward pass: LF = earliest successor LS; LS = LF − duration. Float = LS − ES. Project duration = 23 days. Red identifies critical activities and their controlling links.
Critical path A → D → E → F → G → H takes 2+7+1+3+4+6=23 days.
Question 4(a) — 12 marks
The following information shows the advertising costs and corresponding sales of Moja Enterprises for eight consecutive periods.
Advertising costs x Ksh 000 Sales y Ksh 000 32 250 40 300 42 400 46 420 48 420 50 450 56 500 60 580 (i) Determine the linear regression equation y on x.
(ii) Using the regression equation in (i) above, estimate the sales when advertising costs are Ksh 52,000.
Model answer
| x | y | x² | xy |
|---|---|---|---|
| 32 | 250 | 1,024 | 8,000 |
| 40 | 300 | 1,600 | 12,000 |
| 42 | 400 | 1,764 | 16,800 |
| 46 | 420 | 2,116 | 19,320 |
| 48 | 420 | 2,304 | 20,160 |
| 50 | 450 | 2,500 | 22,500 |
| 56 | 500 | 3,136 | 28,000 |
| 60 | 580 | 3,600 | 34,800 |
| 374 | 3,320 | 18,044 | 161,580 |
b = [nΣxy−ΣxΣy]/[nΣx²−(Σx)²] = (8×161,580.00−374.00×3,320.00)/(8×18,044.00−374.00²) = 11.385165.
a = ȳ−bx̄ = -117.256479.
Regression equation: ŷ=-117.256479+11.385165x, with both variables in Ksh thousands. At x=52, ŷ=474.772118 thousand, so estimated sales = Ksh 474,772.12.
Question 4(b) — 8 marks
Explain the meaning of each of the following terms as used in network analysis: (i) activity; (ii) project; (iii) event; (iv) dummy activity.
Model answer
- An activity is a defined task that takes time and may consume resources; it is represented by an arrow or node depending on the network convention.
- A project is a set of interrelated activities undertaken to achieve a specified objective within defined time and resource limits.
- An event is a milestone marking the start or completion of one or more activities; it consumes no time or resources itself.
- A dummy activity is a zero-duration, zero-resource arrow used in an activity-on-arrow network to preserve precedence relationships or distinguish activities.
Question 5(a) — 10 marks
Explain five roles of quantitative techniques in business decision making.
Model answer
- Forecasting demand and sales from data helps determine future production, purchasing and staffing requirements.
- Optimisation allocates scarce labour, materials and machine time to the activities that best meet a stated objective.
- Inventory models balance ordering, holding and shortage costs to guide replenishment decisions.
- Project scheduling identifies activity dependencies, completion times and critical tasks so managers can control delivery.
- Probability and statistical analysis measure uncertainty, compare alternatives and test claims, supporting more consistent risk-informed decisions.
Question 5(b) — 10 marks
Simon supplied 12 calculators and 30 geometric sets to United College valued at a total of Ksh 21,600. He also supplied 18 calculators and 28 geometric sets to New Life College valued at a total of Ksh 22,200. The items are sold on the same terms to both colleges.
(i) Formulate simultaneous equations from the information above.
(ii) Solve the equations in (i) above using matrices to determine the price of: (I) one calculator; (II) one geometric set.
Model answer
Let x be calculator price and y be geometric-set price. 12x+30y=21,600; 18x+28y=22,200. A[x,y]ᵀ=b with A=
| 12 | 30 |
| 18 | 28 |
det A=12×28−30×18=−204. A⁻¹=(−1/204)
| 28 | -30 |
| -18 | 12 |
Multiply A⁻¹ by [21,600,22,200]ᵀ:
| Step / item | Working | Result |
|---|---|---|
| Calculator x | (28×21,600−30×22,200)/(−204) | 300 |
| Geometric set y | (−18×21,600+12×22,200)/(−204) | 600 |
Check: 12×300+30×600=21,600; 18×300+28×600=22,200.
Question 6(a) — 10 marks
Alpha Manufacturers produces two products P and Q whose contribution per unit is Ksh 60 and Ksh 40 respectively. The resource requirements for each product are as follows:
Resource P Q Total available Skilled labour hours 1 2 6,000 Unskilled labour hours 2 3 9,000 Material kg 4 1 2,000 (i) Formulate a linear programming problem.
(ii) Using the graphical method, determine the optimal product mix.
Model answer
Let x and y be units of P and Q. Maximise Z=60x+40y subject to x+2y≤6,000, 2x+3y≤9,000, 4x+y≤2,000, x,y≥0.
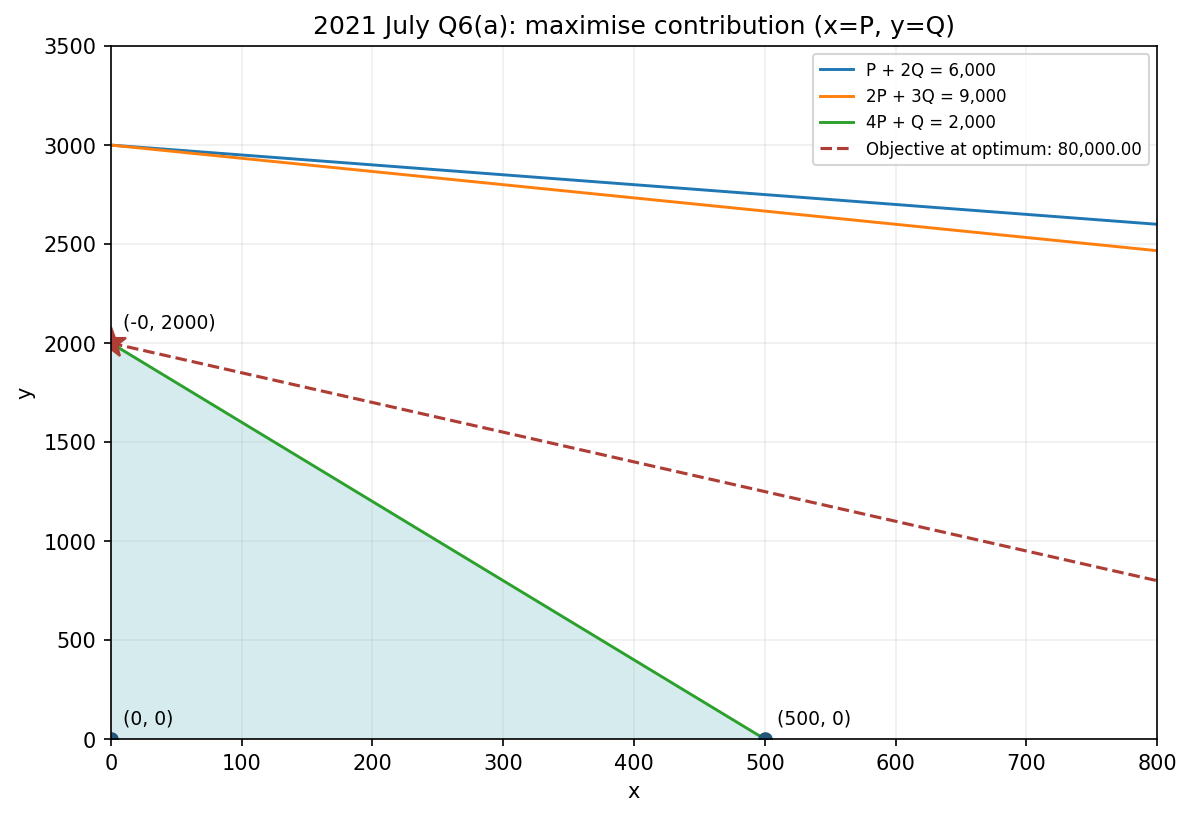
| Feasible corner x | y | Objective cost |
|---|---|---|
| 0 | 0 | 0 |
| -0 | 2,000 | 80,000 |
| 500 | 0 | 30,000 |
Optimal mix: P=0, Q=2,000; maximum contribution Ksh 80,000. This uses all 2,000 kg of material, 4,000 skilled hours and 6,000 unskilled hours. Material is the binding resource; skilled and unskilled capacity remain available.
Question 6(b) — 10 marks
Kajum invested a total of Ksh 1,200,000 in two investment funds A and B. The returns from each fund was 4% and 3% respectively. The total returns from the funds was Ksh 40,000. Calculate the amount of money invested in: (i) fund A; (ii) fund B.
Model answer
| Step | Working |
|---|---|
| Equations | A+B=1,200,000; 0.04A+0.03B=40,000 |
| Eliminate B | Subtract 0.03(A+B)=36,000: 0.01A=4,000 |
| Fund A | A=Ksh 400,000 |
| Fund B | B=1,200,000−400,000=Ksh 800,000 |
| Check | 0.04×400,000+0.03×800,000=16,000+24,000=40,000 |
Question 7(a) — 8 marks
Explain the meaning of each of the following terms as used in probability theory: (i) elementary event; (ii) mutually exclusive events; (iii) equiprobable events; (iv) complementary events.
Model answer
- An elementary event contains exactly one outcome in the sample space, such as rolling a 3 on one die.
- Mutually exclusive events cannot occur together in the same trial: their intersection is empty and P(A∩B)=0.
- Equiprobable events have equal probabilities, such as the individual faces of a fair die.
- Complementary events are an event A and its non-occurrence Aᶜ; together they exhaust the sample space and P(Aᶜ)=1−P(A).
Question 7(b) — 12 marks
A supervisor in a supermarket claims that 20% of the shoppers leave without making a purchase. In a random sample of 80 shoppers selected, it was found that 25 shoppers left without making a purchase. Test the supervisor’s claim at 5% significance level.
Model answer
| Step | Working / conclusion |
|---|---|
| Hypotheses | H₀:p=0.20; H₁:p≠0.20 (two-sided). |
| Sample proportion | p̂=25/80=0.3125 |
| Normal approximation check | np₀=16 and n(1−p₀)=64, both sufficiently large. Assume an independent random sample. |
| Standard error under H₀ | √(0.20×0.80/80)=0.04472136 |
| Test statistic | z=(0.3125−0.20)/0.04472136=2.515576 |
| Critical region | Reject H₀ if z1.96. |
| Decision | 2.5156>1.96, so reject H₀. |
| Conclusion | The sample provides evidence that the true non-purchase proportion differs from 20%; the observed direction is higher. The two-sided p-value is approximately 0.0119. |
November 2021
Paper codes: 2903/204
Time: Not shown in supplied scan
Instructions: Not shown in supplied scan
Question 1(a) — 8 marks
The probability that a train arrives on time at terminus A is 5/6 while the probability that it arrives on time at terminus B is 3/4. Determine the probability that the train arrives: (i) on time at both terminus A and B; (ii) on time in one of the terminals; (iii) late at both terminals.
Model answer
Assume arrival-time events at the two terminals are independent. This is required for multiplying the marginal probabilities; it is not explicitly stated in the question.
| Part | Working | Probability |
|---|---|---|
| Both on time | (5/6)(3/4) | 15/24 = 5/8 = 0.625 |
| Exactly one on time | (5/6)(1/4)+(1/6)(3/4) | 8/24 = 1/3 ≈ 0.333333 |
| Both late | (1/6)(1/4) | 1/24 ≈ 0.041667 |
“One of the terminals” is interpreted as exactly one. If it means at least one, the answer is 1−1/24=23/24. Without independence or a joint probability, the three events cannot be determined uniquely from the marginals alone.
Question 1(b) — 12 marks
Mwamba Limited intends to invest in a project. The following are the activities, preceding activities and durations of the project.
Activity Preceding activity Duration weeks A — 7 B — 10 C A 4 D A 30 E A 7 F B,C 12 G B,C 15 H E,F 11 I E,F 25 J E,F 6 K D,H 19 L G,J 25 M K,I,L 2 (i) Draw a network diagram of the project.
(ii) Determine: I. critical path; II. project duration.
Model answer

| Activity | Predecessors | Duration | ES | EF | LS | LF | Float |
|---|---|---|---|---|---|---|---|
| A | — | 7 | 0 | 7 | 0 | 7 | 0 |
| B | — | 10 | 0 | 10 | 3 | 13 | 3 |
| C | A | 4 | 7 | 11 | 9 | 13 | 2 |
| D | A | 30 | 7 | 37 | 7 | 37 | 0 |
| E | A | 7 | 7 | 14 | 18 | 25 | 11 |
| F | B,C | 12 | 11 | 23 | 13 | 25 | 2 |
| G | B,C | 15 | 11 | 26 | 16 | 31 | 5 |
| H | E,F | 11 | 23 | 34 | 26 | 37 | 3 |
| I | E,F | 25 | 23 | 48 | 31 | 56 | 8 |
| J | E,F | 6 | 23 | 29 | 25 | 31 | 2 |
| K | D,H | 19 | 37 | 56 | 37 | 56 | 0 |
| L | G,J | 25 | 29 | 54 | 31 | 56 | 2 |
| M | K,I,L | 2 | 56 | 58 | 56 | 58 | 0 |
Forward pass: ES = latest predecessor EF; EF = ES + duration. Backward pass: LF = earliest successor LS; LS = LF − duration. Float = LS − ES. Project duration = 58 weeks. Red identifies critical activities and their controlling links.
Critical path A → D → K → M, taking 7+30+19+2=58 weeks.
Question 2(a) — 8 marks
Explain the meaning of each of the following components of a time series: (i) trend; (ii) seasonal variation; (iii) cyclical variation; (iv) random variation.
Model answer
- Trend is the persistent long-term upward, downward or stable movement in a series after shorter fluctuations are smoothed.
- Seasonal variation is a pattern that repeats within a year, such as quarterly or monthly sales changes associated with weather or holidays.
- Cyclical variation is a longer-term rise and fall around the trend, often associated with business cycles and without a fixed within-year period.
- Random variation is irregular, unpredictable movement caused by unusual events or chance influences after systematic components are accounted for.
Question 2(b) — 12 marks
The following information shows the advertising costs and the respective sales revenue of Mika Enterprises for six consecutive periods.
Advertising costs x Ksh Sales revenue y Ksh 2,100 13,600 2,800 15,800 2,200 14,500 3,000 16,200 2,600 14,900 2,500 15,000 (i) Calculate the: I. Pearson’s coefficient of correlation; II. coefficient of determination.
(ii) Interpret the results obtained in (II) above.
Model answer
| x | y | x² | y² | xy |
|---|---|---|---|---|
| 2,100 | 13,600 | 4,410,000 | 184,960,000 | 28,560,000 |
| 2,800 | 15,800 | 7,840,000 | 249,640,000 | 44,240,000 |
| 2,200 | 14,500 | 4,840,000 | 210,250,000 | 31,900,000 |
| 3,000 | 16,200 | 9,000,000 | 262,440,000 | 48,600,000 |
| 2,600 | 14,900 | 6,760,000 | 222,010,000 | 38,740,000 |
| 2,500 | 15,000 | 6,250,000 | 225,000,000 | 37,500,000 |
| 15,200 | 90,000 | 39,100,000 | 1,354,300,000 | 229,540,000 |
r = [nΣxy − ΣxΣy]/√{[nΣx² − (Σx)²][nΣy² − (Σy)²]} = 9,240,000.0000/9,583,736.2234 = 0.964133.
Coefficient of determination R²=r²=0.929553, or 92.96%. In the fitted simple linear relationship, about 92.96% of the sample variation in sales revenue is associated with variation in advertising expenditure. This is explanatory association within the model, not proof that advertising alone causes that share of sales.
Question 3(a) — 12 marks
Mjengo Limited manufactures two products, P and Q using machines A, B and C. Product P requires 2 minutes of machine A, 3 minutes of machine B and 1 minute of machine C. Product Q requires 3 minutes of machine A, 2 minutes of machine B and 1 minute of machine C.
The capacity available per week for each machine is 1,500, 1,500 and 600 for A, B and C respectively. The profit per unit of products P and Q is Ksh 10 and Ksh 12 respectively.
(i) Formulate a linear programming model from the information above.
(ii) Using graphical method, determine the weekly production that maximizes profit.
Model answer
Let x=P units and y=Q units. Maximise Z=10x+12y subject to 2x+3y≤1,500, 3x+2y≤1,500, x+y≤600, x,y≥0. Capacities are interpreted in minutes, consistently with the unit processing times.

| Feasible corner x | y | Objective cost |
|---|---|---|
| 0 | 0 | 0 |
| -0 | 500 | 6,000 |
| 300 | 300 | 6,600 |
| 500 | 0 | 5,000 |
Solve 2x+3y=1,500 and 3x+2y=1,500: x=y=300; x+y=600. Produce 300 P and 300 Q per week for maximum profit Ksh 6,600.
Question 3(b) — 8 marks
Explain four roles of quantitative techniques in business decision making.
Model answer
- Forecasting demand and sales from data helps determine future production, purchasing and staffing requirements.
- Optimisation allocates scarce labour, materials and machine time to the activities that best meet a stated objective.
- Inventory models balance ordering, holding and shortage costs to guide replenishment decisions.
- Project scheduling identifies activity dependencies, completion times and critical tasks so managers can control delivery.
Question 4(a) — 8 marks
Moses bought 2 vests and 3 shirts from a shop and paid a total of Ksh 3,100. Mohammed bought 3 similar vests and one similar shirt from the same shop and paid a total of Ksh 2,200. Using matrices, determine the price of: (i) one vest; (ii) one shirt.
Model answer
Let x=vest price and y=shirt price. Equations: 2x+3y=3,100 and 3x+y=2,200. A=
| 2 | 3 |
| 3 | 1 |
det A=2−9=−7; A⁻¹=(−1/7)
| 1 | -3 |
| -3 | 2 |
Multiply by b=[3,100,2,200]ᵀ:
| Step / item | Working | Result |
|---|---|---|
| Vest x | (3,100−3×2,200)/(−7) | 500 |
| Shirt y | (−3×3,100+2×2,200)/(−7) | 700 |
Check: 2×500+3×700=3,100 and 3×500+700=2,200.
Question 4(b) — 12 marks
Distinguish between each of the following terms as used in probability theory: (i) dependent events and independent events; (ii) permutations and combinations; (iii) compound events and mutually exclusive events.
Model answer
| Pair | First term | Second term |
|---|---|---|
| Dependent / independent | Dependent: occurrence of one event changes the probability of the other; P(A∩B)=P(A)P(B|A). | Independent: occurrence of one does not change the probability of the other; P(A∩B)=P(A)P(B). |
| Permutations / combinations | Permutations count ordered selections: nPᵣ=n!/(n−r)!. | Combinations count unordered selections: nCᵣ=n!/[r!(n−r)!]. |
| Compound / mutually exclusive | A compound event contains more than one elementary outcome, e.g. rolling an even number on a die. | Mutually exclusive describes two or more events that cannot occur together, e.g. an odd and an even result in one roll. This describes a relationship between events, not their number of outcomes. |
Question 5(a) — 10 marks
Panda Limited produces and sells product kx. The average price (P) and total cost (TC) functions are as follows:
P=200−8Q
TC=Q²−16QWhere Q is the number of units produced and sold. Determine the: (i) total revenue (TR) function; (ii) number of units that maximizes profit; (iii) number of units that maximizes revenue; (iv) maximum profit.
Model answer
| Part | Working / result |
|---|---|
| TR function | TR=PQ=200Q−8Q² |
| Profit function | π=TR−TC=216Q−9Q² |
| Profit-maximising quantity | dπ/dQ=216−18Q=0 ⇒ Q=12; d²π/dQ²=−18<0 |
| Revenue-maximising quantity | dTR/dQ=200−16Q=0 ⇒ Q=12.5; second derivative −16<0 |
| Maximum profit | π(12)=216×12−9×144=1,296 monetary units |
If whole units are mandatory, revenue is the same at Q=12 and Q=13 (1,248 monetary units); the continuous maximum at 12.5 is 1,250. The question does not impose integrality.
Question 5(b) — 10 marks
Matemu Limited used material V20 in its production process. The annual demand is 2,000 units. The following details relate to the material.
Particulars Ksh Cost per unit Ksh 5 Ordering cost per order Ksh 500 Annual carrying cost per unit Ksh 200 Working days per year 300 Determine the: (i) EOQ; (ii) number of orders to be placed in one year; (iii) time interval between orders; (iv) total inventory cost.
Model answer
| Step / item | Working | Result |
|---|---|---|
| EOQ | √(2×2,000×500/200) | 100 |
| Orders per year | 2,000/100 | 20 |
| Time between orders | 300/20 working days | 15 |
| Annual ordering cost | 20×500 | 10,000 |
| Annual holding cost | 100/2×200 | 10,000 |
| Relevant ordering + holding cost | 10,000+10,000 | 20,000 |
| Annual purchase cost | 2,000×5 | 10,000 |
| Total inventory cost including purchase | 20,000+10,000 | 30,000 |
The unusually high holding cost is used exactly as supplied. Basic EOQ assumptions include steady demand, no shortages and no safety stock.
Question 6(a) — 10 marks
Tom deposited Ksh 150,000 in an account paying compound interest at the rate of 10% per annum for four years.
(i) Calculate the: I. amount in his account at the end of the fourth year; II. interest earned at the end of the fourth year.
(ii) Peter wanted to have the same amount as in (I) above by depositing a certain sum of money in an account for a period of 3 years at a compound interest rate of 10% per annum. Calculate the amount to be deposited at the beginning of the three year period.
Model answer
| Step / item | Working | Result |
|---|---|---|
| Tom’s future amount | 150,000(1.1)⁴ | 219,615.00 |
| Tom’s interest | 219,615−150,000 | 69,615.00 |
| Peter’s required present deposit | 219,615/(1.1)³ | 165,000 |
Check: 165,000(1.1)³=219,615.
Question 6(b) — 10 marks
The manager of Pona Pharmaceuticals Limited claims that the average content of medicine in a bottle is 0.5 litres. A random sample of 100 bottles is selected and the mean content is found to be 0.45 litres with a standard deviation of 0.10 litres. Test the manager’s claim at 5% level of significance.
Model answer
| Step | Working / decision |
|---|---|
| Hypotheses | H₀:μ=0.50 litre; H₁:μ≠0.50 litre. |
| Method | Large-sample two-sided mean test using s to estimate σ; assume independent random sampling. |
| Standard error | 0.10/√100=0.01 litre |
| Statistic | z=(0.45−0.50)/0.01=−5.00 |
| Critical values | ±1.96 at α=0.05 |
| Decision | |−5|>1.96: reject H₀. |
| Conclusion | The data provide strong evidence that the population mean content differs from 0.5 litre; the sample indicates a lower mean. A one-sample t-test with df=99 also rejects at 5% (critical value about ±1.984). |
Question 7(a) — 8 marks
Explain the meaning of each of the following terms as used in network analysis: (i) dangling activity; (ii) loop; (iii) slack; (iv) dummy activity.
Model answer
- A dangling activity is an activity or path left improperly disconnected from the project’s intended start/finish flow, creating an incomplete logical network.
- A loop is a directed cycle that returns to an earlier event/activity, creating circular precedence; it is not permitted in a conventional project network.
- Event slack is latest permissible event time minus earliest event time; it measures how long that event may be delayed without delaying project completion.
- A dummy activity is a zero-duration, zero-resource arrow used in an activity-on-arrow network to preserve precedence logic or uniquely identify activities.
Question 7(b) — 12 marks
The following table shows the prices and quantities of three commodities for the years 2010 and 2016.
Commodity 2010 price p₀ Ksh 2010 quantity q₀ 2016 price p₁ Ksh 2016 quantity q₁ Bread 65 20 135 30 Sugar 95 8 160 7 Rice 150 5 320 8 (i) Calculate: I. Laspeyre’s price index; II. Paasche’s price index; III. Fisher’s ideal price index.
(ii) Interpret the result in (III) above.
Model answer
| Commodity | p₀q₀ | p₁q₀ | p₀q₁ | p₁q₁ |
|---|---|---|---|---|
| Bread | 1,300 | 2,700 | 1,950 | 4,050 |
| Sugar | 760 | 1,280 | 665 | 1,120 |
| Rice | 750 | 1,600 | 1,200 | 2,560 |
| Total | 2,810 | 5,580 | 3,815 | 7,730 |
| Step / item | Working | Result |
|---|---|---|
| Laspeyres price index | 5,580/2,810 × 100 | 198.58 |
| Paasche price index | 7,730/3,815 × 100 | 202.62 |
| Fisher ideal price index | √(198.576512 × 202.621232) | 200.59 |
With 2010=100, Fisher’s ideal price index is 200.59, indicating an aggregate weighted price rise of approximately 100.59% by 2016.