KNEC Diploma in Supply Chain Management, Module II. Original theory examination questions with explained model answers for revision.
July 2022
Paper codes: 2903/204 Time: Not shown in supplied scan Instructions: Not shown in supplied scan
Question 1(a) — 8 marks
Explain four limitations of quantitative techniques in business decision making.
Model answer
Results depend on reliable data; incomplete, biased or outdated figures can produce misleading recommendations.
Models simplify reality and depend on assumptions that may not hold in changing business conditions.
Qualitative factors such as morale, ethics and customer relationships are difficult to express fully as numbers.
Building and maintaining models may require costly data systems, specialist staff and time.
Question 1(b) — 12 marks
A research study revealed that the monthly expenditure on food by 20,000 families in Mulika County is normally distributed with a mean of Ksh 6,000 and a standard deviation of Ksh 1,000.
(i) Determine the probability that a family selected at random spends on food between: (I) Ksh 6,000 and Ksh 7,250 per month; (II) Ksh 5,000 and Ksh 8,000 per month.
(ii) Determine the number of families that spend between Ksh 5,000 and Ksh 8,000 on food per month.
Model answer
Standardise using Z=(X−6,000)/1,000.
Part
Z limits
Working
Result
(i)(I)
0 and 1.25
Φ(1.25) − Φ(0)
0.394350
(i)(II)
−1 and 2
Φ(2) − Φ(−1)
0.818595
(ii)
−1 to 2
20,000 × 0.818595
16,371.89 ≈ 16,372 families
Using a normal table rounded to four decimal places gives 0.3944 and 0.8186 respectively; slight rounding differences in the estimated family count are expected.
Question 2(a) — 10 marks
Highlight five steps followed in hypothesis testing.
Model answer
State the null and alternative hypotheses and identify the population parameter being tested.
Choose a significance level and an appropriate one-sided or two-sided test, checking its assumptions.
Obtain sample data and calculate the selected test statistic.
Compare the statistic with the critical value, or compare its p-value with the chosen significance level.
Reject or fail to reject H₀ and state the conclusion in the context of the problem.
Question 2(b) — 10 marks
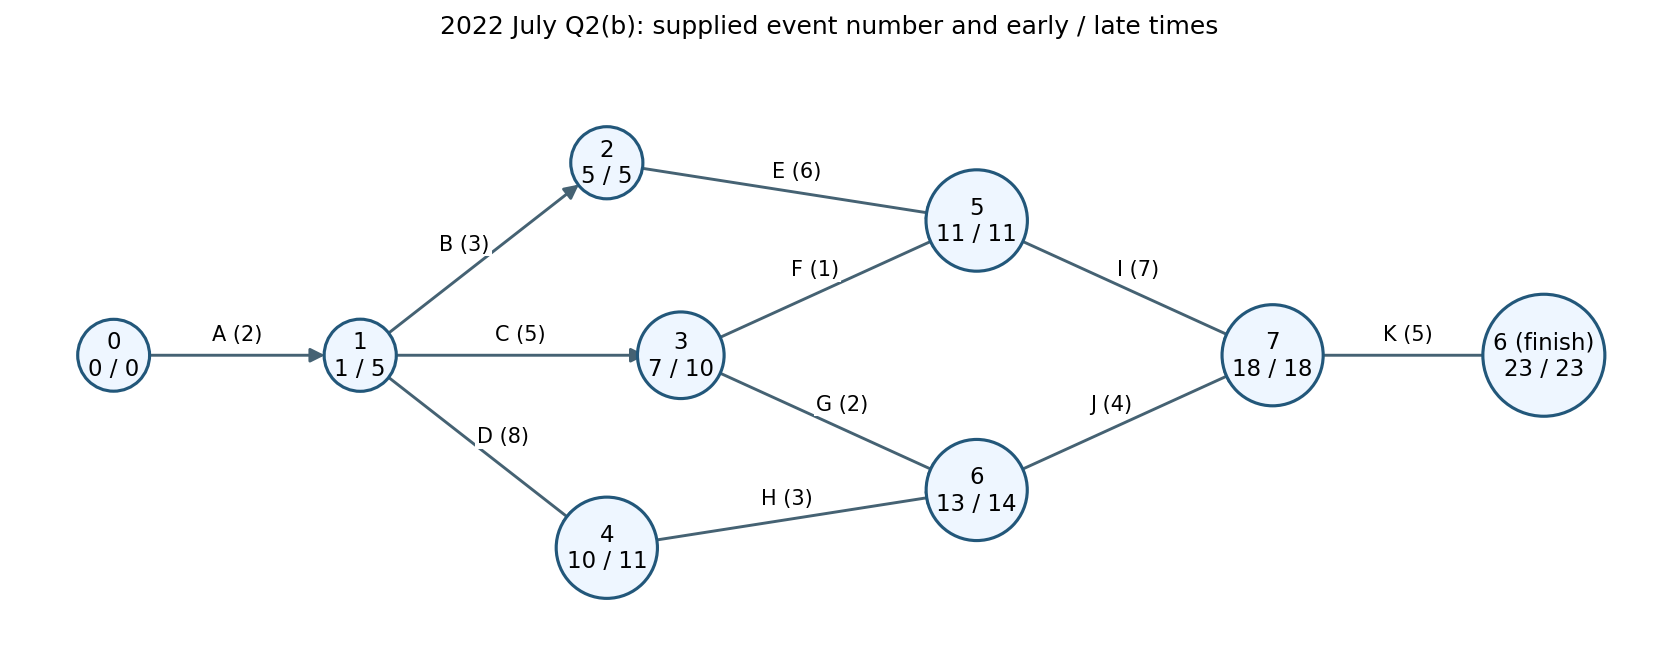
The following is a network diagram of a project.
2022 July Q2(b): supplied event number and early / late times
(i) Calculate each of the following: (I) slack of event 3; (iii) slack of event 6.
(ii) Calculate each of the following floats for activity G: (I) total float; (II) free float; (III) independent float.
Model answer
Use the event times printed in the source: E₃=7, L₃=10; E₆=13, L₆=14; activity G runs from event 3 to the lower event 6 and has duration 2. Event slack = late time − early time.
Step / item
Working
Result
Event 3 slack
10 − 7
3
Lower event 6 slack
14 − 13
1
G total float: Lⱼ − Eᵢ − d
14 − 7 − 2
5
G free float: Eⱼ − Eᵢ − d
13 − 7 − 2
4
G independent float: max(0,Eⱼ − Lᵢ − d)
max(0,13 − 10 − 2)
1
The supplied drawing labels the final event “6” as well. The event 6 used above is the lower event reached by G; the final event’s slack is 23−23=0. Some other printed event times are inconsistent with a fresh forward pass, so this answer explicitly uses the given event times rather than silently replacing them.
Question 3(a) — 8 marks
ABC Limited uses material Mx in its production process. The following information relates to the material for the year 2016.
Item
Value
Minimum consumption per day
100 units
Normal consumption per day
160 units
Maximum consumption per day
280 units
Re-order quantity
2,600 units
Minimum reorder period
4 days
Maximum reorder period
8 days
Normal reorder period
6 days
Calculate the: (i) reorder stock level; (ii) maximum stock level; (iii) minimum stock level; (iv) average stock level.
Model answer
Step / item
Working
Result
Reorder level
280 × 8
2,240
Maximum stock
2,240 + 2,600 − 100×4
4,440
Minimum stock
2,240 − 160×6
1,280
Average stock
1,280 + 2,600/2
2,580
The average uses minimum stock plus half the order quantity. The alternative midpoint of maximum and minimum is (4,440+1,280)/2=2,860 units, a different convention.
Question 3(b) — 12 marks
Three judges, A, B, and C in a drama competition awarded 12 competitors the following marks.
Student
A
B
C
D
E
F
G
H
I
J
K
L
Judge A
55
58
59
46
57
45
53
56
50
62
48
51
Judge B
54
55
58
50
57
45
56
44
48
43
47
53
Judge C
48
52
49
58
62
53
51
59
54
55
46
57
(i) Calculate the Spearman’s rank correlation between each pair of judges.
(ii) Based on the result in (i) above, comment on the pair of judges who are most consistent in the award of marks.
Model answer
Competitor
Rank A
Rank B
Rank C
(A−B)²
(A−C)²
(B−C)²
A
6
5
11
1
25
36
B
3
4
8
1
25
16
C
2
1
10
1
64
81
D
11
7
3
16
64
16
E
4
2
1
4
9
1
F
12
10
7
4
25
9
G
7
3
9
16
4
36
H
5
11
2
36
9
81
I
9
8
6
1
9
4
J
1
12
5
121
16
49
K
10
9
12
1
4
9
L
8
6
4
4
16
4
Total
206
270
342
Highest mark is rank 1. No ties occur. For n=12, rₛ = 1 − 6Σd²/[n(n²−1)].
Pair
Σd²
rₛ
A / B
206
0.279720
A / C
270
0.055944
B / C
342
-0.195804
Judges A and B are most consistent: their correlation is the highest of the three pairs. A and C show almost no rank association; B and C show a weak inverse association.
Question 4(a) — 8 marks
The following is a linear programming model of two products x and y. Objective function: minimize 12x + 8y.
x + y H 100 0.3x + 0.1y H 15 0.1x + 0.05y H 8 0.2x + 0.4y H 25 x H 0 y H 0
Using the graphical method, determine the number of units of product x and product y to be produced in order to minimize costs.
Model answer
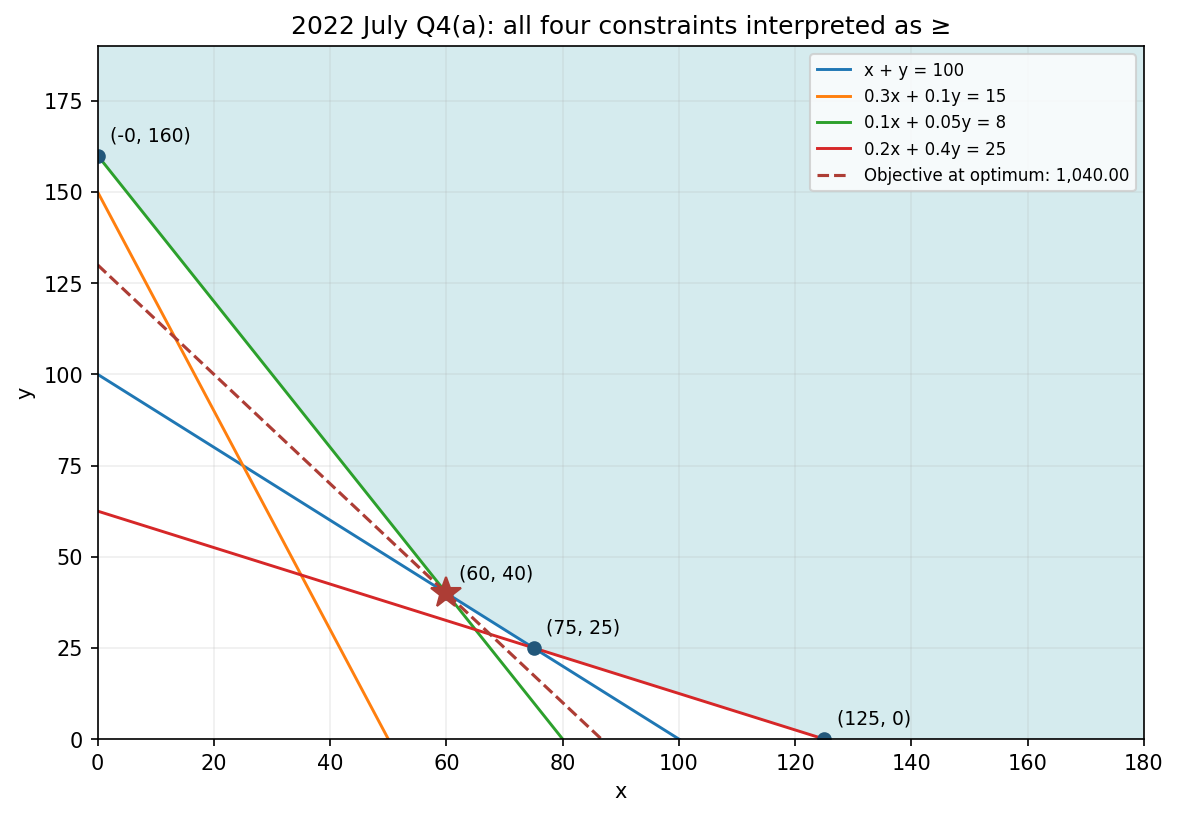
Source sign problem: the printed comparison symbols appear as “H”, including the non-negativity lines. Their directions cannot be established reliably from the printed model. The following solution states its interpretation rather than treating it as certain.
Case A: interpret all four resource constraints as ≥ and x,y ≥ 0. Draw each boundary, shade the common region above all four lines, and evaluate its corner points.
2022 July Q4(a): all four constraints interpreted as ≥; shaded area is feasible
Feasible corner x
y
Objective cost
-0
160
1,280
60
40
1,040
75
25
1,100
125
0
1,500
The optimum is x=60, y=40, with minimum cost 12×60 + 8×40 = 1,040. Solve x+y=100 and 0.1x+0.05y=8 to obtain this corner.
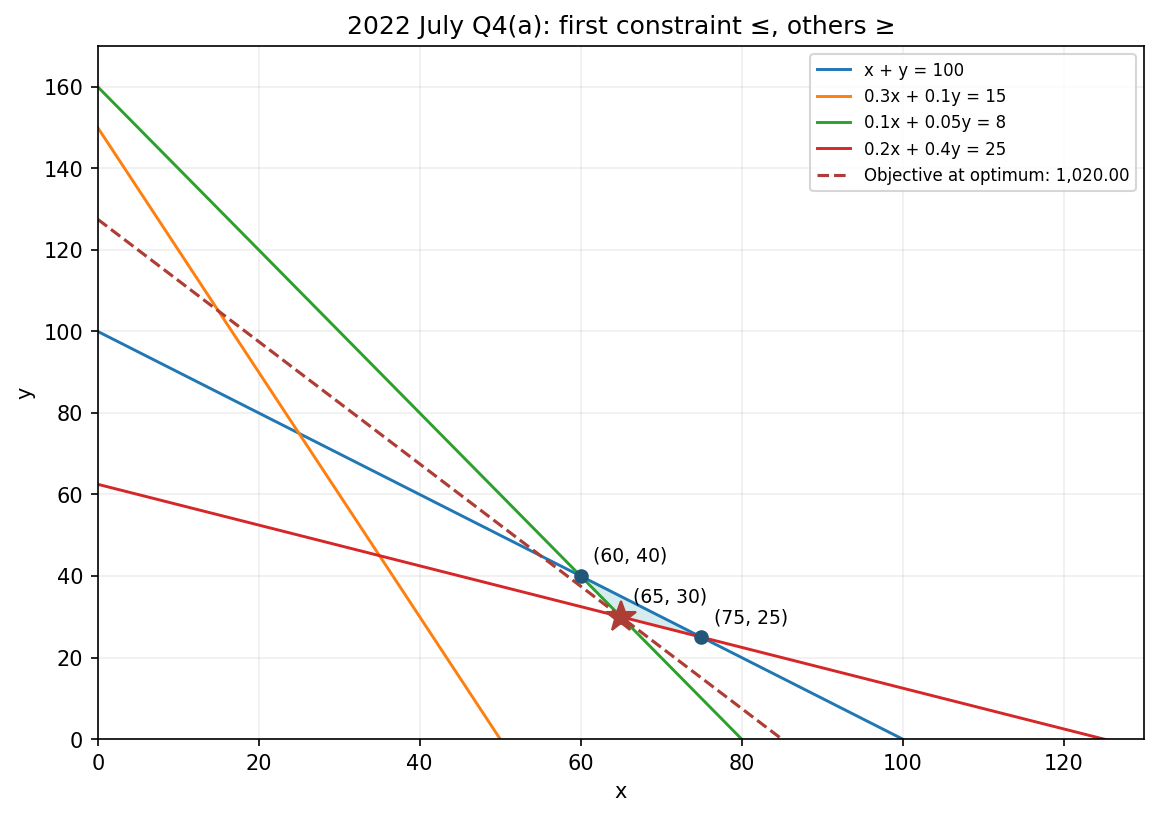
Case B: a handwritten annotation in the supplied copy suggests x+y≤100. If that first direction is used with the other three ≥ constraints, the result changes:
2022 July Q4(a): first constraint ≤, others ≥; shaded area is feasible
Feasible corner x
y
Objective cost
60
40
1,040
65
30.00
1,020
75
25
1,100
Then the optimum is x=65, y=30 and minimum cost 1,020, from 0.1x+0.05y=8 and 0.2x+0.4y=25. This conditional comparison demonstrates why the missing directions matter; neither interpretation should be presented as a uniquely legible printed model.
Question 4(b) — 12 marks
The following table shows the prices and quantities of three commodities A, B and C for the years 2012 and 2016.
Explain the meaning of each of the following types of matrices using an example in each case: (i) singular matrix; (ii) diagonal matrix; (iii) transpose matrix; (iv) column matrix.
Model answer
(i) A singular matrix is a square matrix with determinant zero, so it has no inverse. Example det=1×4−2×2=0:
1
2
2
4
(ii) A diagonal matrix is square with all off-diagonal entries zero:
3
0
0
5
(iii) A transpose is obtained by exchanging rows and columns. If A=[1,2,3], Aᵀ is:
1
2
3
(iv) A column matrix has exactly one column. For example:
4
7
Question 6(a) — 12 marks
Distinguish each of the following terms as used in the test of hypothesis: (i) null and alternate hypothesis; (ii) type I error and type II error; (iii) one tailed test and two tailed test.
Model answer
Pair
First term
Second term
Null / alternative
H₀ is the baseline claim about a population parameter, usually including equality.
H₁ states the departure for which evidence is sought, e.g. μ>μ₀ or μ≠μ₀.
Type I / Type II
Type I: reject a true H₀; probability α.
Type II: fail to reject a false H₀; probability β.
One-tailed / two-tailed
One-tailed alternative specifies a direction (> or <), putting the rejection region in one tail.
Two-tailed alternative specifies a difference in either direction (≠), splitting α between both tails.
Question 6(b) — 8 marks
Jane deposited Ksh 100,000 in an account paying compound interest at the rate of 10% per annum. Determine the amount in her account at the end of three years if compounding is done: (i) annually; (ii) semi-annually; (iii) quarterly.
Model answer
F=P(1+r/m)ᵐᵗ with P=100,000, r=0.10, t=3.
Compounding
Working
Amount Ksh
Annually
100,000(1.10)³
133,100.00
Semi-annually
100,000(1.05)⁶
134,009.56
Quarterly
100,000(1.025)¹²
134,488.88
Question 7(a) — 10 marks
Keko Limited manufactures and sells a special type of wheat flour. The following are the company’s demand (p) and total cost (TC) functions:
P=100−0.01q TC=50q+30,000
where q is the quantity in kilograms of wheat flour produced and sold. Determine the: (i) total revenue (TR) function; (ii) quantity that maximizes the total revenue; (iii) quantity that maximizes the profit.
Model answer
Part
Working
Result
TR
q(100−0.01q)
100q−0.01q²
Revenue maximum
dTR/dq=100−0.02q=0; second derivative −0.02<0
q=5,000 kg
Profit function
TR−TC
50q−0.01q²−30,000
Profit maximum
dπ/dq=50−0.02q=0; second derivative −0.02<0
q=2,500 kg
Question 7(b) — 10 marks
The following information relates to a project to be undertaken by Kazi Limited.
Activity
Preceding activity
Duration days
A
—
8
B
—
10
C
—
6
D
A
10
E
B
12
F
B
8
G
B,C
5
H
D,E
14
I
F,G
11
J
H,I
5
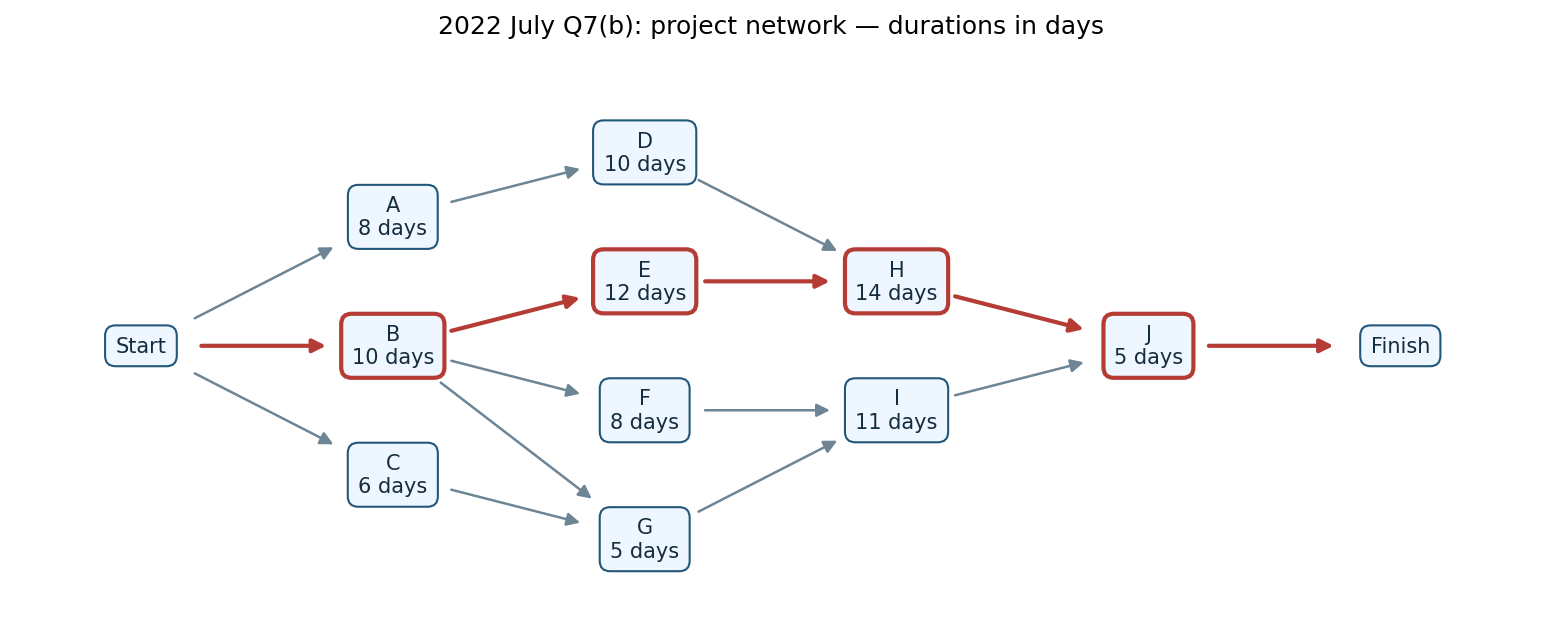
(i) Draw a network diagram of the project.
(ii) Determine the: (I) critical path; (II) project duration.
Model answer
2022 July Q7(b): project network — durations in days
Activity
Predecessors
Duration
ES
EF
LS
LF
Float
A
—
8
0
8
4
12
4
B
—
10
0
10
0
10
0
C
—
6
0
6
14
20
14
D
A
10
8
18
12
22
4
E
B
12
10
22
10
22
0
F
B
8
10
18
17
25
7
G
B,C
5
10
15
20
25
10
H
D,E
14
22
36
22
36
0
I
F,G
11
18
29
25
36
7
J
H,I
5
36
41
36
41
0
Forward pass: ES = latest predecessor EF; EF = ES + duration. Backward pass: LF = earliest successor LS; LS = LF − duration. Float = LS − ES. Project duration = 41 days. Red identifies critical activities and their controlling links.
Critical path B → E → H → J takes 10+12+14+5=41 days.
November 2022
Paper codes: 2903/204 Time: Not shown in supplied scan Instructions: Not shown in supplied scan
Question 1(a) — 8 marks
Explain five uses of index numbers in decision making.
Model answer
They measure changes in the general price level, helping managers assess inflation and purchasing power.
Cost-of-living indices provide a benchmark for reviewing wages, allowances and other indexed payments.
Price indices deflate money sales or income so real changes can be separated from price changes.
Output and quantity indices compare production or sales volumes across periods, supporting performance review.
Industry and input-price indices support budgeting, procurement price comparisons and escalation clauses in contracts.
Question 1(b) — 12 marks
The following information relates to a project to be undertaken by a company:
Activity
Preceding activities
Time duration weeks
A
—
7
B
—
10
C
B
15
D
A
17
E
A
14
F
C,E
9
G
B
15
H
D
7
I
F,H,J
11
J
G
12
K
G
7
L
I,K
9
(i) Draw a network diagram of the project.
(ii) Determine the: I. critical path; II. project duration.
Model answer
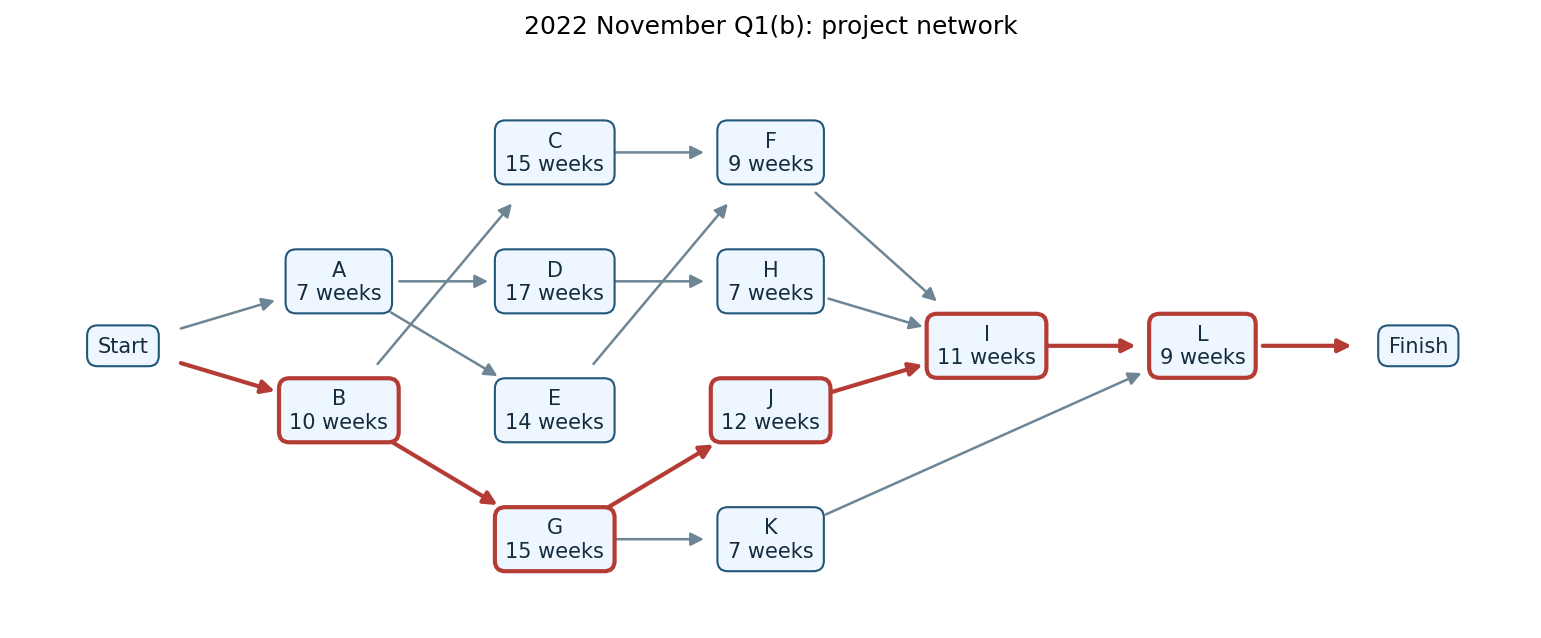
2022 November Q1(b): project network
Activity
Predecessors
Duration
ES
EF
LS
LF
Float
A
—
7
0
7
6
13
6
B
—
10
0
10
0
10
0
C
B
15
10
25
13
28
3
D
A
17
7
24
13
30
6
E
A
14
7
21
14
28
7
F
C,E
9
25
34
28
37
3
G
B
15
10
25
10
25
0
H
D
7
24
31
30
37
6
J
G
12
25
37
25
37
0
I
F,H,J
11
37
48
37
48
0
K
G
7
25
32
41
48
16
L
I,K
9
48
57
48
57
0
Forward pass: ES = latest predecessor EF; EF = ES + duration. Backward pass: LF = earliest successor LS; LS = LF − duration. Float = LS − ES. Project duration = 57 weeks. Red identifies critical activities and their controlling links.
Critical path B → G → J → I → L: 10+15+12+11+9=57 weeks.
Question 2(a) — 10 marks
Explain the meaning of each of the following types of matrices, giving an example in each case: (i) equal matrices; (ii) row matrix; (iii) transpose matrix; (iv) scalar matrix; (v) square matrix.
Model answer
(i) Matrices are equal when they have the same dimensions and equal corresponding entries. For example A=B=
1
2
3
4
(ii) A row matrix has exactly one row, e.g.
2
5
7
(iii) The transpose interchanges rows and columns. For A=[2,5,7], Aᵀ=
2
5
7
(iv) A scalar matrix is diagonal with the same number on every main-diagonal position, e.g. 3I=
3
0
0
3
(v) A square matrix has equal numbers of rows and columns, e.g. this 2×2 matrix:
1
4
2
6
Question 2(b) — 10 marks
The following information shows the number of years of experience and the corresponding number of units produced by employees of a company in a certain month.
Years of experience
Units produced
16
54
22
56
7
59
30
44
44
49
53
30
10
54
26
44
(i) Calculate Pearson’s coefficient of correlation.
The sample shows a strong negative linear association: employees with more years of experience tend to have lower measured output in this dataset. This association does not by itself show that experience causes lower productivity.
Question 3(a) — 10 marks
Outline five limitations of quantitative techniques in business decision making.
Model answer
Results depend on reliable data; incomplete, biased or outdated figures can produce misleading recommendations.
Models simplify reality and depend on assumptions that may not hold in changing business conditions.
Qualitative factors such as morale, ethics and customer relationships are difficult to express fully as numbers.
Building and maintaining models may require costly data systems, specialist staff and time.
Managers may misinterpret precise-looking results or apply them beyond the model’s scope; judgement and sensitivity checks remain necessary.
Question 3(b) — 10 marks
A factory uses 3 machines; J, K and L to make pens. Machine J makes 35% of the pens, machine K makes 40% of the pens and the rest are made by machine L. It is known that 5% of the pens made using machine J are faulty, 3% of the pens made using machine K are faulty and 2% of the pens made using machine L are faulty. A pen is selected at random. Calculate the possibility that:
(i) the pen is made using machine J and is not faulty;
(ii) the pen is faulty and is made using either machine K or machine L;
(iii) the pen is made using machine L and is faulty.
Model answer
P(L)=1−0.35−0.40=0.25. Multiply the probability of selecting a machine’s output by the conditional fault or non-fault probability. K and L are mutually exclusive sources.
Step / item
Working
Result
J and not faulty
0.35 × (1−0.05)
0.33
Faulty and (K or L)
0.40×0.03 + 0.25×0.02
0.02
L and faulty
0.25×0.02
0.01
Question 4(a) — 10 marks
Highlight five rules followed when drawing network diagrams.
Model answer
Represent every activity and its immediate precedence relationships accurately; an activity starts only when all its prerequisites are complete.
Draw the network in a consistent direction, normally left to right, with no directed loops.
Provide a clear project start and finish, connecting every activity to the overall project flow.
Use unique activity labels and consistent notation; in activity-on-arrow networks, distinguish activities sharing events with dummy activities where required.
Keep the drawing clear with arrows showing direction and durations labelled; dummy activities have zero duration and consume no resources.
Question 4(b) — 10 marks
The following is the average revenue (AR) function and total cost (TC) function of a firm:
AR=3000−0.05q TC=5,000+6q=q²
Where q is the level of output produced and sold. Determine the: (i) total revenue function; (ii) level of output that maximises profit; (iii) profit function; (iv) price that maximises profit; (v) maximum profit.
Model answer
Source printing problem: the cost line is printed “TC=5,000+6q=q²”. This is not an unambiguous cost function for an optimisation problem. Total revenue is nevertheless TR=q×AR=3,000q−0.05q².
The following worked solution is conditional on the likely intended cost function TC=5,000+6q+q²; the missing plus sign is an assumption, not a transcription of the source.
Step
Working
Profit function
π(q)=TR−TC=2,994q−1.05q²−5,000
Maximise profit
dπ/dq=2,994−2.1q=0 ⇒ q=1,425.714286
Maximum check
d²π/dq²=−2.1<0
Price
3,000−0.05(1,425.714286)=2,928.714286
Maximum profit
2,994q−1.05q²−5,000 at q=1,425.714286 = 2,129,294.29
If whole units are required, compare q=1,425 and 1,426; q=1,426 gives the higher profit, Ksh 2,129,294.20. A different intended cost sign would require a different solution, so the original equation must be clarified for a unique unconditional result.
Question 5(a) — 8 marks
A company uses component TQ in its production process. The following information relates to the company’s inventory policy:
Item
Minimum
Normal
Maximum
Lead time days
4
8
12
Demand units per day
80
110
140
The company’s EOQ and safety stock level are 300 units and 160 units respectively.
(i) Calculate the: I. re-order level; II. minimum stock level; III. maximum stock level.
(ii) Outline two factors that determine the re-order level.
Model answer
Using the standard maximum-demand/maximum-lead-time stock-level convention:
Step / item
Working
Result
Reorder level
140 × 12
1,680
Minimum stock
1,680 − 110×8
800
Maximum stock
1,680 + 300 − 80×4
1,660
Inconsistency: the implied minimum reserve is 800 units, which conflicts with the separately supplied safety stock of 160. If the explicit safety-stock policy takes priority, reorder level = normal lead-time demand + safety stock = 110×8+160 = 1,040 units; minimum reserve = 160 units. Substituting that reorder level into the same classical maximum formula gives 1,040+300−80×4=1,020 units. The question combines two different stock-policy assumptions; these alternatives should be stated rather than mixed.
Reorder level depends principally on (1) expected demand/usage and its variability, and (2) replenishment lead time and its variability. Desired service level determines the safety allowance for those uncertainties.
Question 5(b) — 12 marks
Mary has received Ksh 2,400,000 in form of retirement benefits. She intends to invest the money in one of the following options:
Option 1: invest in a mutual fund that pays 10% compound interest per year compounded half yearly for 3 years.
Option 2: invest in a company that pays 15% simple interest per annum for 3 years.
Option 3: invest Ksh 800,000 at the beginning of each year for 3 years in an account paying 10% compound interest per annum.
(i) Calculate the amount accumulated under each investment option over the 3 year period.
(ii) Based on the results in (i) above, advise Mary on the option to invest in.
Model answer
Option
Working
Amount after 3 years Ksh
1
2,400,000(1+0.10/2)⁶
3,216,229.54
2
2,400,000(1+0.15×3)
3,480,000
3: annuity due
800,000[(1.1)³+(1.1)²+1.1]
2,912,800.00
Option 3 deposits earn interest for 3, 2 and 1 years respectively because deposits are at the beginning of each year; no interest is specified for cash waiting to be deposited. On the stated amounts alone, with risk, charges and liquidity assumed comparable, option 2 has the highest maturity value: Ksh 3,480,000.
Question 6(a) — 8 marks
The sales manager of a company claims that their daily sales have increased after conducting an inhouse sales training. Before the training the daily sales were Ksh 60,000. A sample of 16 sales persons from the company was selected at random after the training and the average sales were found to be Ksh 95,000 with a standard deviation of Ksh 1,100. Test the manager’s claim at 5% significance level.
Model answer
Step
Working / decision
Hypotheses
H₀: μ≤60,000 (test at μ₀=60,000); H₁: μ>60,000.
Test
One-sample right-tailed t-test; population σ unknown; df=16−1=15. Assume independent observations and a suitable approximately normal population.
Standard error
s/√n = 1,100/4 = 275
Statistic
t=(95,000−60,000)/275 = 127.2727
Critical value
t₀.₉₅,₁₅ ≈ 1.7531
Decision
127.2727 > 1.7531: reject H₀.
Conclusion
There is strong evidence that mean daily sales exceed Ksh 60,000 after training, supporting the manager’s increase claim. A before/after comparison alone does not establish training as the sole cause.
Question 6(b) — 12 marks
The following data shows the production in tonnes of a product manufactured by a company over a period of eight years.
Year
Units produced tonnes
2012
21
2013
20
2014
22
2015
29
2016
27
2017
18
2018
12
2019
22
(i) Using the least squares method, determine the linear regression equation of the data above.
(ii) Using the equation in (i) above, estimate the production for the year 2022.
Model answer
Let x=year−2015.5, so Σx=0.
Year
y
Centred x
x²
xy
2012
21
-3.50
12.25
-73.50
2013
20
-2.50
6.25
-50
2014
22
-1.50
2.25
-33
2015
29
-0.50
0.25
-14.50
2016
27
0.50
0.25
13.50
2017
18
1.50
2.25
27
2018
12
2.50
6.25
30
2019
22
3.50
12.25
77
Total
171
0
42
-23.50
a=Σy/8=21.375000; b=Σxy/Σx²=-0.559524. Regression/trend equation: ŷ=21.375000+(-0.559524)(year−2015.5). For 2022, x=6.5, giving estimated production 17.74 tonnes.
Question 7(a) — 10 marks
An ICT examination was conducted for 200 students in a college. The marks scored were found to be normally distributed with a mean of 66 marks and a standard deviation of 5 marks. Calculate the number of students whose marks were:
(i) above 68 marks;
(ii) between 56 marks and 70 marks;
(iii) below 72 marks.
Model answer
Z=(X−66)/5; expected number=200×probability. Round estimated counts to the nearest whole student.
Event
Z
Probability
Expected number
Rounded count
X>68
Z>0.4
0.344578
68.92
69
56<X<70
−2<Z<0.8
0.765394
153.08
153
X<72
Z<1.2
0.884930
176.99
177
Question 7(b) — 10 marks
A company uses two types of components; S and T to manufacture a product. The per unit costs of the components S and T are Ksh 3,500 and Ksh 4,500 respectively. A unit of a product requires 4 units of component S and 8 units of component T. The company intends to purchase at least a total of 13 components. The current market demand for the product is at least 64 units.
(i) Formulate a linear programming problem from the information above.
(ii) Using the graphical approach, determine the number of components of each type that should be purchased in order to minimize total costs.
Model answer
Literal reading of the supplied wording: x and y are units of components S and T purchased. To make at least 64 finished units requires x≥4×64=256 and y≥8×64=512. Also x+y≥13 and x,y≥0. Minimise C=3,500x+4,500y.
2022 November Q7(b): literal component requirements (x=S, y=T); shaded area is feasible
Feasible corner x
y
Objective cost
256
512
3,200,000
The lowest feasible corner is x=256, y=512, with cost 3,500×256+4,500×512=Ksh 3,200,000. The 13-component condition is redundant on this reading.
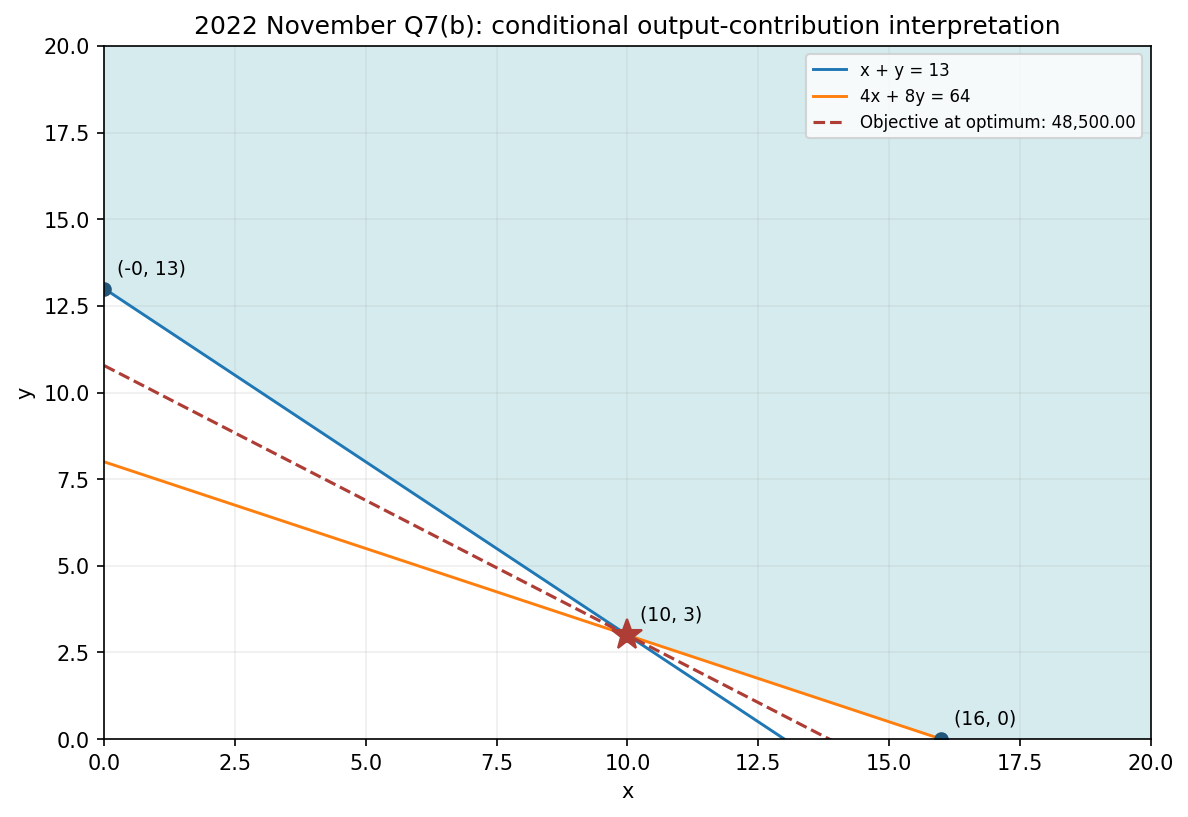
Possible intended examination model: if the phrase were intended to say that each purchased S and T contributes 4 and 8 units of output, respectively, the constraints would instead be x+y≥13 and 4x+8y≥64. That is a different meaning from “a product requires 4 S and 8 T”. Its graphical solution is:
2022 November Q7(b): conditional output-contribution interpretation; shaded area is feasible
Feasible corner x
y
Objective cost
-0
13
58,500
10
3
48,500
16
0
56,000
For that conditional model, solve x+y=13 and x+2y=16 to obtain x=10, y=3, with cost Ksh 48,500. Both readings are shown so the wording discrepancy is visible; the conditional result must not be described as the literal component requirement.
Finish Course Early?
You have not completed all required lessons and assessments.