Managerial Accounting — 2023
KNEC Diploma in Supply Chain Management, Module III. Original examination questions with explained answers for revision. Answers are independently prepared for study and are not an official KNEC marking scheme.
March/April 2023
Paper codes: 2903/305; 2906/305; 2907/305; 2926/305; 3103
Time: 3 hours. Answer any FIVE of the SEVEN questions. All questions carry equal marks. Answer in English. Show all your workings.
Question 1(a) — 8 marks
Explain each of the following terms as used in Managerial Accounting:
(i) Budget;
(ii) Performance evaluation;
(iii) Marginal costing technique;
(iv) Responsibility accounting.
Answer
- Budget: a quantified plan for a future period, setting expected revenues, costs, activities and resources.
- Performance evaluation: assessing actual results against targets, standards or other benchmarks and explaining significant differences.
- Marginal costing technique: charge variable production costs to units and treat fixed production overhead as a period cost; sales less variable costs gives contribution.
- Responsibility accounting: organise budgets and reports by centres whose managers are accountable for controllable costs, revenues, profits or investments.
Question 1(b) — 12 marks
A voter registration centre uses a single queue to register potential voters. The arrival and service are random and follow poisson distribution. The inter arrival time of persons is 7.5 minutes while the mean service time at the centre is 6 minutes.
Determine the:
(i) expected number of potential voters waiting in the queue;
(ii) expected number of potential voters in the queuing system;
(iii) expected time a potential voter spends in the queuing system;
(iv) expected time a potential voter waits in the queue;
(v) expected proportion of time that the registration clerk is idle.
Answer
λ = 60 ÷ 7.5 = 8 per hour; μ = 60 ÷ 6 = 10 per hour.
Use the stable M/M/1 model: one server, Poisson arrivals, independent exponential service times and λ < μ. Service completions are counted per time interval; service durations are exponential.
| Item | Working | Result |
|---|---|---|
| Arrival rate λ | Convert arrivals to an hourly rate | 8 per hour |
| Service rate μ | Convert services to an hourly rate | 10 per hour |
| Busy proportion ρ | λ / μ | 0.8000 = 80.00% |
| Idle proportion P₀ | 1 − ρ | 0.2000 = 20.00% |
| Mean queue length Lq | λ² / [μ(μ − λ)] | 3.20 |
| Mean number in system L | λ / (μ − λ) | 4 |
| Mean time in system W | 1 / (μ − λ) | 0.500000 hour = 30 minutes |
| Mean waiting time Wq | λ / [μ(μ − λ)] | 0.400000 hour = 24 minutes = 1440 seconds |
Question 2(a) — 8 marks
During the year 2021, Kolo Manufacturers produced 10,000 units and incurred the following costs:
Cost Ksh Rent 1,000,000 Electricity (30% fixed) 720,000 Water (90% variable) 600,000 Repair and maintenance (20% fixed) 1,800,000 Direct materials 10,500,000 Direct labour 3,500,000 Salaries 1,364,000 (i) Using the account analysis method, determine the: (I) variable cost per unit; (II) total fixed costs.
(ii) Formulate a linear cost equation in the form of: y = a + bx.
(iii) Estimate the total cost to be incurred if the company produces 14,000 units.
Answer
| Cost (Ksh) | Total | Fixed portion | Variable portion |
|---|---|---|---|
| Rent | 1,000,000 | 1,000,000 | 0 |
| Electricity | 720,000 | 216,000 | 504,000 |
| Water | 600,000 | 60,000 | 540,000 |
| Repair and maintenance | 1,800,000 | 360,000 | 1,440,000 |
| Direct materials | 10,500,000 | 0 | 10,500,000 |
| Direct labour | 3,500,000 | 0 | 3,500,000 |
| Salaries | 1,364,000 | 1,364,000 | 0 |
| Total | 19,484,000 | 3,000,000 | 16,484,000 |
| Item | Working | Result |
|---|---|---|
| Variable cost per unit | 16,484,000 ÷ 10,000 | 1,648.40 |
| Total fixed cost | Sum of fixed portions | 3,000,000 |
| Linear cost function | Y = a + bx | Y = 3,000,000 + 1,648.40x |
| Cost at 14,000 units | 3,000,000 + 1,648.40 × 14,000 | 26,077,600 |
Question 2(b) — 12 marks
The management of Mboy Limited intends to manufacture either Product X or Product Y. The following are the expected net profits or losses and associated probabilities under different economic conditions.
Economic condition Probability Product X (Ksh) Product Y (Ksh) Boom 0.30 1,000,000 1,200,000 Neutral 0.40 800,000 900,000 Recession 0.30 200,000 -100,000 (i) Draw a decision tree to present the information above.
(ii) For each of the products, calculate the Expected Monetary Value (EMV).
(iii) A consultancy firm has offered to provide perfect information to the management at a cost of Ksh. 100,000. Advise the management on whether to hire the consultancy firm or not.
Answer
- Without additional information, select Product Y because its EMV of Ksh. 690,000 exceeds Product X’s Ksh. 680,000.
- Perfect information would permit Product Y in boom and neutral conditions, and Product X in recession. Its maximum worth is EVPI = Ksh. 90,000.
- Do not hire the consultancy at Ksh. 100,000: the fee exceeds even the value of perfect information by Ksh. 10,000.
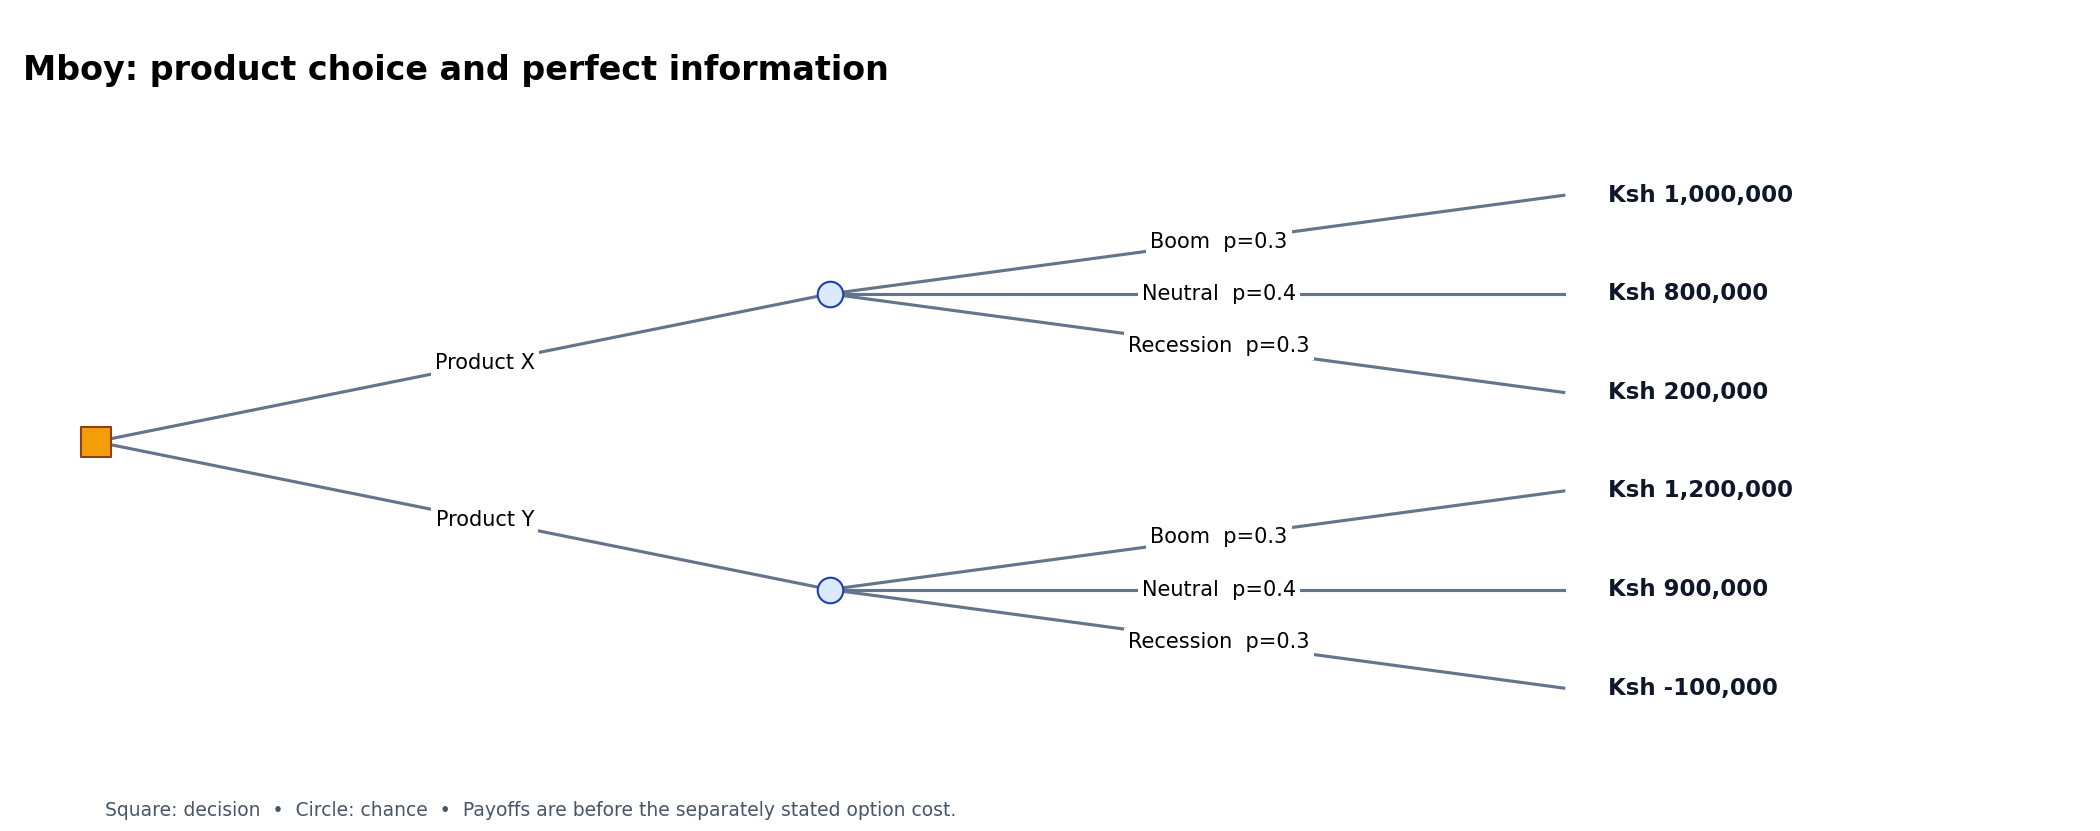
| Alternative | Σ probability × payoff | Expected gross payoff | Option cost | Net EMV (Ksh) |
|---|---|---|---|---|
| Product X | 0.3 × (1,000,000) + 0.4 × (800,000) + 0.3 × (200,000) | 680,000 | 0 | 680,000 |
| Product Y | 0.3 × (1,200,000) + 0.4 × (900,000) + 0.3 × (-100,000) | 690,000 | 0 | 690,000 |
| Item | Working | Result |
|---|---|---|
| Expected value with perfect information | .3 × 1,200,000 + .4 × 900,000 + .3 × 200,000 | 780,000 |
| Best EMV without perfect information | Product Y | 690,000 |
| EVPI | 780,000 − 690,000 | 90,000 |
| Net value of buying the information | 90,000 − 100,000 | -10,000 |
Question 3(a) — 8 marks
Highlight four objectives of performance evaluation in an organization.
Answer
- Measure achievement: compare actual outcomes with agreed objectives and budgets.
- Identify problems: reveal adverse cost, revenue or efficiency variances requiring investigation.
- Support decisions: provide evidence for resource allocation, training and operational improvements.
- Motivate and establish accountability: give managers feedback and reward results they can influence while supporting organisational goals.
Question 3(b) — 12 marks
Caleb Limited intends to invest in a project that has the following expected cash flows.
Year Expected cash flow (Ksh) 0 -6,000,000 1 500,000 2 600,000 3 3,700,000 4 4,000,000 5 1,000,000 The cost of capital is 14%.
(i) Determine the Internal Rate of Return (IRR) using discount rates of 14% and 16%, respectively.
(ii) Based on the results obtained in (i) above, advise the management on whether to invest in the project or not.
Answer
- Invest in the project: the estimated IRR is about 15.618%, above the 14% cost of capital. Its NPV at 14% is positive.
At 14%: discount rate 14%. PV = cash flow ÷ (1 + r)ⁿ. All amounts are Ksh.
| Year | Net cash flow | Discount factor | Present value |
|---|---|---|---|
| 1 | 500,000 | 0.877193 | 438,596.49 |
| 2 | 600,000 | 0.769468 | 461,680.52 |
| 3 | 3,700,000 | 0.674972 | 2,497,394.61 |
| 4 | 4,000,000 | 0.592080 | 2,368,321.11 |
| 5 | 1,000,000 | 0.519369 | 519,368.66 |
| Total PV | 6,285,361.39 | ||
| Initial investment (time 0) | -6,000,000 | ||
| NPV | 285,361.39 |
At 16%: discount rate 16%. PV = cash flow ÷ (1 + r)ⁿ. All amounts are Ksh.
| Year | Net cash flow | Discount factor | Present value |
|---|---|---|---|
| 1 | 500,000 | 0.862069 | 431,034.48 |
| 2 | 600,000 | 0.743163 | 445,897.74 |
| 3 | 3,700,000 | 0.640658 | 2,370,433.39 |
| 4 | 4,000,000 | 0.552291 | 2,209,164.39 |
| 5 | 1,000,000 | 0.476113 | 476,113.02 |
| Total PV | 5,932,643.02 | ||
| Initial investment (time 0) | -6,000,000 | ||
| NPV | -67,356.98 |
| Item | Working | Result |
|---|---|---|
| Interpolated IRR | 14% + [285,361.39 ÷ (285,361.39 − (-67,356.98))] × 2 percentage points | 15.618% |
IRR is a linear interpolation estimate; full-precision discount factors are used, so answers using the printed four-decimal tables can differ slightly.
Question 4(a) — 8 marks
The following information relates to Delly Limited for the first six months of the year 2021.
Month Output (units) Total cost of production (Ksh ‘000) January 64 13,210 February 60 13,620 March 72 14,150 April 90 14,600 May 100 15,020 June 96 14,980 (i) Using the high-low method, determine the: (I) variable cost per unit; (II) fixed cost of production; (IV) linear cost function in the form of: y = a + bx.
(ii) The company’s fixed cost will increase by 40% when the output exceeds 100 units. Calculate the estimated total cost of producing 120 units.
Answer
The question’s costs are in Ksh ‘000. Multiply by 1,000 before presenting the answer in shillings; the printed subpart sequence skips (III).
| Item | Working | Result |
|---|---|---|
| Highest activity | x = 100; cost = 15,020,000 | |
| Lowest activity | x = 60; cost = 13,620,000 | |
| Variable cost per unit | (15,020,000 − 13,620,000) ÷ (100 − 60) | 35,000 |
| Fixed cost | 15,020,000 − 35,000 × 100 | 11,520,000 |
| Cost function | Y = a + bx | Y = 11,520,000 + 35,000x |
| Cost at 120 units | 11,520,000 × 1.4 + 35,000 × 120 | 20,328,000 |
Select the highest and lowest activity levels, rather than the highest and lowest cost observations.
Question 4(b) — 12 marks
Pakn Limited manufactures and sells a single product, PK30. The following are the costs of the firm for the year 2021:
Cost Ksh Direct labour cost per unit 22 Direct material cost per unit 12 Variable overheads per unit 16 Annual fixed costs 400,000 Additional information: The selling price per unit is Ksh. 70. The company has a capacity of producing a maximum of 40,000 units in a year.
(i) On the provided graph paper, construct a break-even chart.
(ii) Using the chart in (i) above, determine the: (I) break-even point in units and in shillings; (II) margin of safety in units and in shillings.
(iii) Determine the profit that will be made when 30,000 units are produced and sold.
Answer
- The question gives maximum capacity of 40,000 units but no separate expected sales volume. The reported margin of safety assumes the company sells at that capacity.
- If margin of safety is instead required for the later 30,000-unit scenario, it is 10,000 units, or Ksh. 700,000. A margin of safety always needs a stated sales basis.

| Item | Working | Result |
|---|---|---|
| Variable cost/unit | 22 + 12 + 16 | 50 |
| Contribution/unit | 70 − 50 | 20 |
| Break-even units | 400,000 ÷ 20 | 20,000 |
| Break-even sales | 20,000 × 70 | 1,400,000 |
| MOS at full-capacity sales | 40,000 − 20,000 | 20,000 units |
| MOS value at full capacity | 20,000 × 70 | 1,400,000 |
| Profit at 30,000 units | 30,000 × 20 − 400,000 | 200,000 |
Question 5(a) — 10 marks
Kase Limited manufactures and sells detergents. The company hires four salespersons; Ann, Joy, John and Peter to sell in each of the towns; Kitui, Garissa, Eldoret and Narok. Each salesperson is assigned to each town. The following table shows the daily sales, in thousands of shillings, made by each salesperson.
Town Ann Joy John Peter Kitui 20 18 14 22 Garissa 16 22 20 10 Eldoret 15 19 16 20 Narok 10 12 8 14 Determine the:
(i) optimal assignment schedule that will maximize daily sales;
(ii) maximum daily sales.
Answer
Maximise by converting each entry to an opportunity loss: 22 minus the original entry. Apply the Hungarian method. Reduce each row by its smallest entry, then reduce each column by its smallest entry.
After row reduction:
| Ann | Joy | John | Peter | |
|---|---|---|---|---|
| Kitui | 2 | 4 | 8 | 0 |
| Garissa | 6 | 0 | 2 | 12 |
| Eldoret | 5 | 1 | 4 | 0 |
| Narok | 4 | 2 | 6 | 0 |
After column reduction:
| Ann | Joy | John | Peter | |
|---|---|---|---|---|
| Kitui | 0 | 4 | 6 | 0 |
| Garissa | 4 | 0 | 0 | 12 |
| Eldoret | 3 | 1 | 2 | 0 |
| Narok | 2 | 2 | 4 | 0 |
Cover zeros with rows Garissa and columns Ann, Peter. Minimum uncovered entry = 1. Subtract it from uncovered cells and add it at line intersections.
| Ann | Joy | John | Peter | |
|---|---|---|---|---|
| Kitui | 0 | 3 | 5 | 0 |
| Garissa | 5 | 0 | 0 | 13 |
| Eldoret | 3 | 0 | 1 | 0 |
| Narok | 2 | 1 | 3 | 0 |
Choose four independent zeros, with one assignment in every row and column. Read the values from the original table:
| Assign | To | Ksh ‘000 |
|---|---|---|
| Kitui | Ann | 20 |
| Garissa | John | 20 |
| Eldoret | Joy | 19 |
| Narok | Peter | 14 |
| Maximum | 73 |
Maximum daily sales in shillings = 73 × 1,000 = Ksh. 73,000.
Question 5(b) — 10 marks
Lax Limited manufactures and sells electric kettles. Currently the company produces and sells 7,000 electric kettles which is 70% of the company’s production capacity. The selling price per electric kettle is Ksh. 4,200. The following are the variable production costs per electric kettle.
Cost per kettle Ksh Direct materials 600 Direct labour 800 Variable production overheads 200 The fixed administration and selling costs are Ksh. 4,500,000 per annum. The firm has received a special order of 3,000 electric kettles at a price of Ksh. 3,500 each. If the order is accepted, it will utilize the idle capacity.
(i) Using marginal costing approach, prepare: (I) current income statement; (II) income statement if the order is accepted.
(ii) Advise the management on whether to accept the order or not.
Answer
- Capacity is 7,000 ÷ 70% = 10,000 units; the 3,000-unit order exactly uses idle capacity.
- Accept the order if fixed costs remain unchanged and it does not displace regular sales or reduce their price. Incremental contribution and profit are Ksh. 5,700,000.
| Marginal income statement (Ksh) | Current | Special order increment | After acceptance |
|---|---|---|---|
| Sales | 29,400,000 | 10,500,000 | 39,900,000 |
| Variable cost (1,600/unit) | 11,200,000 | 4,800,000 | 16,000,000 |
| Contribution | 18,200,000 | 5,700,000 | 23,900,000 |
| Fixed administration/selling | 4,500,000 | 0 | 4,500,000 |
| Profit | 13,700,000 | 5,700,000 | 19,400,000 |
Question 6(a) — 8 marks
Explain each of the following types of transfer pricing:
(i) Full cost transfer pricing;
(ii) Marginal cost plus transfer pricing;
(iii) Market based transfer pricing;
(iv) Negotiated transfer pricing.
Answer
- Full cost: charge the receiving division the production cost including allocated fixed overhead; a profit mark-up may be added if specified.
- Marginal cost plus: charge the variable or incremental cost of the transfer plus an agreed margin; identify any capacity opportunity cost separately.
- Market based: use a comparable external market price, adjusted for selling or distribution costs avoided on internal transfers.
- Negotiated: divisional managers agree a price within a range acceptable to both, subject to group objectives and capacity constraints.
Question 6(b) — 12 marks
Mbogo Limited has three warehouses in which it stores maize. The maize is sold to three different maize milling firms; M1, M2 and M3. On 1 January 2021, the company had the following quantities of maize available from the warehouses.
Warehouse Bags available W1 800 W2 1,200 W3 700
Milling firm Bags required M1 900 M2 1,100 M3 700 The cost of transporting one bag of maize from each warehouse to the milling firm is as follows (Ksh).
M1 M2 M3 W1 40 30 20 W2 45 28 40 W3 25 32 35 Using the Vogel’s Approximation Method (VAM), determine the:
(i) optimal schedule that will minimize the total transportation cost;
(ii) optimal schedule that will minimize the total transportation cost;
Answer
The printed requirements (i) and (ii) are identical. The answer gives the VAM schedule, checks optimality and states the minimum total cost.
VAM allocation steps:
| Step | Route | Selection | Quantity |
|---|---|---|---|
| 1 | W1 → M3 | column M3; penalty 15 | 700 |
| 2 | W2 → M2 | row W2; penalty 17 | 1,100 |
| 3 | W2 → M1 | row W2; penalty 45 | 100 |
| 4 | W1 → M1 | row W1; penalty 40 | 100 |
| 5 | W3 → M1 | row W3; penalty 25 | 700 |
Initial basic feasible schedule:
| Source → destination | M1 | M2 | M3 | Supply |
|---|---|---|---|---|
| W1 | 100 | 0 | 700 | 800 |
| W2 | 100 | 1,100 | 0 | 1,200 |
| W3 | 700 | 0 | 0 | 700 |
| Demand | 900 | 1,100 | 700 | 2,700 |
Initial transportation cost = Σ(quantity × unit cost) = 70,800 Ksh.
The initial allocation method produces a feasible schedule, but does not by itself prove minimum cost. Apply MODI: uᵢ + vⱼ = cᵢⱼ on basic cells and Δᵢⱼ = cᵢⱼ − uᵢ − vⱼ on nonbasic cells. A negative Δ permits a cost reduction; adjust alternating +/− cells by θ. Zero basic allocations may be used for degeneracy.
No improving negative reduced cost exists in the initial schedule.
Optimal schedule:
| Source → destination | M1 | M2 | M3 | Supply |
|---|---|---|---|---|
| W1 | 100 | 0 | 700 | 800 |
| W2 | 100 | 1,100 | 0 | 1,200 |
| W3 | 700 | 0 | 0 | 700 |
| Demand | 900 | 1,100 | 700 | 2,700 |
| Row potentials u | W1 | W2 | W3 |
|---|---|---|---|
| Value | 0 | 5 | -15 |
| Column potentials v | M1 | M2 | M3 |
|---|---|---|---|
| Value | 40 | 23 | 20 |
Final reduced costs (all are nonnegative, proving optimality):
| M1 | M2 | M3 | |
|---|---|---|---|
| W1 | 0 | 7 | 0 |
| W2 | 0 | 0 | 15 |
| W3 | 0 | 24 | 30 |
Cost working: 100 × 40 + 700 × 20 + 100 × 45 + 1,100 × 28 + 700 × 25 = 70,800 Ksh.
Question 7(a) — 10 marks
Manuh Limited is in the process of preparing its budgets. The following estimates relate to the year 2023.
2023 February March April May June Purchases (Ksh) 300,000 200,000 500,000 400,000 250,000 Sales (Ksh) 400,000 300,000 200,000 250,000 300,000 Wages (Ksh) 150,000 150,000 150,000 200,000 200,000 Overheads (Ksh) 60,000 60,000 60,000 70,000 70,000 Additional information: (I) The expected cash balance on 1 April, 2023 is Ksh. 150,000. (II) All purchases and sales are on credit terms. (III) Creditors are paid 50% in the month of purchase, 40% in the month following, and 10% in the third month. (IV) Debtors settle 60% in the month of sale and 40% in the following month. (V) Overheads are paid one month after they are incurred. (VI) Wages are paid in the month they are incurred.
(i) Prepare a cash budget for each of the months of April, May and June 2023.
(ii) Based on the results in (i) above, advise the management on the action to take.
Answer
- Treat the “third month” as two months after purchase. No discounts, bad debts or other receipts are stated.
- Arrange a cash facility before April, reaching at least Ksh. 955,000 by June if the plan is unchanged. Also accelerate collections, negotiate payment dates and review discretionary spending. Negative balances show financing needs; they are not assumed approved overdrafts.
| Cash budget (Ksh) | April | May | June |
|---|---|---|---|
| Opening balance | 150,000 | -180,000 | -630,000 |
| Receipts: 60% current sales | 120,000 | 150,000 | 180,000 |
| Receipts: 40% prior sales | 120,000 | 80,000 | 100,000 |
| Total receipts | 240,000 | 230,000 | 280,000 |
| Supplier: 50% current purchases | 250,000 | 200,000 | 125,000 |
| Supplier: 40% prior purchases | 80,000 | 200,000 | 160,000 |
| Supplier: 10% two months earlier | 30,000 | 20,000 | 50,000 |
| Wages | 150,000 | 200,000 | 200,000 |
| Prior-month overheads | 60,000 | 60,000 | 70,000 |
| Total payments | 570,000 | 680,000 | 605,000 |
| Net cash movement | -330,000 | -450,000 | -325,000 |
| Closing balance | -180,000 | -630,000 | -955,000 |
Question 7(b) — 10 marks
Reagan Limited produces and sells a single product, P24. The standard cost of producing one unit is as shown below.
Unit cost Ksh Direct materials 24 Direct labour 15 Variable production overheads 6 Actual results for the year 2021: (i) Selling, distribution and administration expenses: fixed Ksh. 40,000; variable 10% of sales value. (ii) Fixed production costs amounted to Ksh. 50,000. (iii) Selling price per unit was Ksh. 105. (iv) Units produced and sold were 3,000 and 2,500 respectively. Prepare income statement using the marginal costing technique.
Answer
| Item | Working | Result |
|---|---|---|
| Variable manufacturing cost/unit | 24 + 15 + 6 | 45 |
| Closing inventory | (3,000 − 2,500) × 45 | 22,500 |
| Marginal income statement (Ksh) | Amount |
|---|---|
| Sales: 2,500 × 105 | 262,500 |
| Variable production: 3,000 × 45 | 135,000 |
| Less closing inventory | -22,500 |
| Variable cost of goods sold | 112,500 |
| Variable selling/distribution/admin: 10% sales | 26,250 |
| Contribution | 123,750 |
| Fixed production costs | 50,000 |
| Fixed selling/distribution/admin | 40,000 |
| Profit | 33,750 |