Managerial Accounting — Undated papers
KNEC Diploma in Supply Chain Management, Module III. Original examination questions with explained answers for revision. Answers are independently prepared for study and are not an official KNEC marking scheme.
The supplied scan has no complete printed examination date. Dates inside a question are accounting periods, not the examination year.
Undated supplied paper
Paper codes: Not visible in supplied scan
Question 1(a) — 8 marks
Explain four differences between Management Accounting and Financial Accounting.
Answer
- Users and purpose: management accounting supports internal planning and decisions; financial accounting reports financial position and performance mainly to external users.
- Time focus: management accounting can use forecasts and forward-looking estimates as well as history; financial statements primarily summarise past transactions.
- Rules and format: internal management reports are tailored to decision needs; external financial statements follow applicable reporting standards and prescribed disclosure requirements.
- Detail and frequency: management reports can analyse individual products or departments whenever needed; financial statements usually summarise the whole entity for regular reporting periods.
Question 1(b) — 12 marks
The following balances were extracted from the books of account of Wotu Limited for the year 2017.
Item (Ksh) First half of year Second half of year Sales 90,000 100,000 Total cost 80,000 86,000 There is no change in prices and variable costs and the fixed costs are incurred equally in the two half year periods. For the year 2017, determine the:
(i) profit / volume (P/V) ratio;
(ii) fixed costs;
(iii) break even sales;
(iv) percentage of margin of safety.
Answer
| Item | Working | Result |
|---|---|---|
| Variable-cost/sales ratio | (86,000 − 80,000) ÷ (100,000 − 90,000) | 60% |
| P/V ratio | 1 − .60 | 40% |
| Fixed cost per half year | 80,000 − .60 × 90,000 | 26,000 |
| Annual fixed cost | 26,000 × 2 | 52,000 |
| Annual sales | 90,000 + 100,000 | 190,000 |
| Annual break-even sales | 52,000 ÷ .40 | 130,000 |
| Margin of safety | 190,000 − 130,000 | 60,000 |
| MOS percentage | 60,000 ÷ 190,000 × 100 | 31.58% |
Question 2(a) — 10 marks
The following information relates to Kowelu Manufacturers for the first six months of the year 2017.
Month Production volume (units) Electricity cost (Ksh) January 12,600 144,000 February 4,500 72,000 March 3,300 48,000 April 8,700 96,000 May 15,300 156,000 June 6,600 96,000 (i) Using the High-Low method, determine: (I) fixed cost; (II) variable cost per unit. (ii) Based on the results in (i), formulate an equation for determining the total cost of electricity. (iii) Using the equation, estimate the total cost of electricity when the production volume is 14,000 units.
Answer
| Item | Working | Result |
|---|---|---|
| Highest activity | x = 15,300; cost = 156,000 | |
| Lowest activity | x = 3,300; cost = 48,000 | |
| Variable cost per unit | (156,000 − 48,000) ÷ (15,300 − 3,300) | 9 |
| Fixed cost | 156,000 − 9 × 15,300 | 18,300 |
| Cost function | Y = a + bx | Y = 18,300 + 9x |
| Cost at 14,000 units | 18,300 × 1 + 9 × 14,000 | 144,300 |
Select the highest and lowest activity levels, rather than the highest and lowest cost observations.
Question 2(b) — 10 marks
There is one printing machine in a bank. Requests for printing are sent at the rate of 30 copies per hour, according to a Poisson distribution. Printing service follows an Exponential distribution, with a time interval of 40 seconds between services. Determine the:
(i) percentage of time that the printing machine is used;
(ii) average length of the queue;
(iii) average number of printing requests in the system;
(iv) average time spent in the queue;
(v) average time spent in the system.
Answer
λ = 30 requests per hour; μ = 3,600/40 = 90 per hour. W = 1 minute (60 seconds), and Wq = 1/3 minute (20 seconds).
Use the stable M/M/1 model: one server, Poisson arrivals, independent exponential service times and λ < μ. Service completions are counted per time interval; service durations are exponential.
| Item | Working | Result |
|---|---|---|
| Arrival rate λ | Convert arrivals to an hourly rate | 30 per hour |
| Service rate μ | Convert services to an hourly rate | 90 per hour |
| Busy proportion ρ | λ / μ | 0.3333 = 33.33% |
| Idle proportion P₀ | 1 − ρ | 0.6667 = 66.67% |
| Mean queue length Lq | λ² / [μ(μ − λ)] | 0.17 |
| Mean number in system L | λ / (μ − λ) | 0.50 |
| Mean time in system W | 1 / (μ − λ) | 0.016667 hour = 1 minutes |
| Mean waiting time Wq | λ / [μ(μ − λ)] | 0.005556 hour = 0.333333 minutes = 20 seconds |
Question 3(a) — 10 marks
Explain five requirements of a transportation problem.
Answer
- Identifiable sources and destinations must exist, with known quantities of supply and demand for the same planning period.
- The product must be sufficiently homogeneous and quantities divisible or otherwise compatible with the allocation units.
- Unit transportation costs must be known for each allowed route and the total objective must be additive and approximately linear.
- The tableau must be balanced: total supply equals total demand, using a clearly identified dummy source or destination when necessary.
- A clear objective and route restrictions: normally minimise total delivery cost while satisfying supply and destination requirements; identify prohibited routes or capacity limits before allocation.
Question 3(b) — 10 marks
The following are the production costs of a factory for the year 2017.
2017 production cost Ksh Direct wages 160,000 Direct materials 240,000 Fixed production overhead 80,000 Variable production overhead 120,000 In the coming year, it is expected that:
(i) the rate of direct labour remuneration will fall from Ksh. 1.60 per hour to Ksh. 1.50 per hour;
(ii) production will increase by 25%;
(iii) production efficiency will be reduced by 5%;
(iv) price per unit of direct material and other materials and services, which comprise overheads, will remain unchanged.
Prepare a production cost budget for the year 2018.
Answer
- Treat the efficiency reduction as a reduction in labour output per hour to 95% of the prior rate. Therefore hours needed for the planned output are divided by 0.95.
- Material and variable overhead quantities are assumed to scale with output because no separate revised usage rates are given; their prices are unchanged. Fixed overhead remains fixed within the relevant capacity range.
- If an examiner instead uses the approximation of adding 5% to labour hours, labour would be Ksh. 196,875 and total cost Ksh. 726,875. The main calculation uses the exact efficiency-ratio interpretation.
| Item | Working | Result |
|---|---|---|
| 2017 labour hours | 160,000 ÷ 1.60 | 100,000 |
| Hours at 25% greater output before efficiency change | 100,000 × 1.25 | 125,000 |
| 2018 labour hours at 95% of previous efficiency | 125,000 ÷ .95 | 131,578.95 |
| Production cost budget 2018 (Ksh) | Working | Amount |
|---|---|---|
| Direct wages | 100,000 × 1.25 ÷ .95 × 1.50 | 197,368.42 |
| Direct materials | 240,000 × 1.25 | 300,000 |
| Fixed production overhead | Unchanged | 80,000 |
| Variable production overhead | 120,000 × 1.25 | 150,000 |
| Total budgeted production cost | 727,368.42 |
Question 4(a) — 10 marks
Explain five characteristics of a simple queue.
Answer
- One service channel handles customers from a single waiting line.
- Arrivals are independent and random, normally represented by a Poisson process with a constant mean rate.
- Service times are independent and exponentially distributed with a constant mean service rate.
- For the usual steady-state M/M/1 results, the service rate exceeds the arrival rate; customers normally follow first-come, first-served discipline.
- The standard simple model assumes an effectively unlimited calling population and waiting space, with no balking or reneging, so customers remain until served.
Question 4(b) — 10 marks
Kalindo Limited intends to invest Ksh. 2,000,000 in either Project A or Project B. The following are the expected cash inflows from the projects.
Year Project A (Ksh) Project B (Ksh) 1 500,000 400,000 2 600,000 200,000 3 800,000 500,000 4 400,000 1,200,000 5 — 800,000 6 — 600,000 (i) Calculate the payback period of each project.
(ii) Based on the results in (i) above, advise the management on the project to invest in.
Answer
- Assume cash is received uniformly within the recovery year for the fractional-year estimate.
- Choose A under the payback criterion: 3.25 years is shorter than B’s 3.75 years. This criterion ignores post-payback cash flows and the time value of money, so it is not a complete profitability comparison.
| Year | A cash inflow | A cumulative | B cash inflow | B cumulative |
|---|---|---|---|---|
| 1 | 500,000 | 500,000 | 400,000 | 400,000 |
| 2 | 600,000 | 1,100,000 | 200,000 | 600,000 |
| 3 | 800,000 | 1,900,000 | 500,000 | 1,100,000 |
| 4 | 400,000 | 2,300,000 | 1,200,000 | 2,300,000 |
| 5 | 0 | 2,300,000 | 800,000 | 3,100,000 |
| 6 | 0 | 2,300,000 | 600,000 | 3,700,000 |
| Item | Working | Result |
|---|---|---|
| Payback A | 3 + (2,000,000 − 1,900,000) ÷ 400,000 | 3.25 years |
| Payback B | 3 + (2,000,000 − 1,100,000) ÷ 1,200,000 | 3.75 years |
Question 5(a) — 12 marks
Wete Enterprises sells clay bricks. The following information is for the year ended 31 December 2017.
Item Ksh Sales 200,000 Raw material cost 48,000 Direct labour cost 28,000 Variable manufacturing overheads 18,000 Fixed manufacturing overheads 14,000 Variable distribution and administration expenses 9,000 Fixed distribution and administration expenses 10,000 Using marginal costing approach, prepare an income statement for the year ended 31 December 2017.
Answer
| Marginal income statement (Ksh) | Amount |
|---|---|
| Sales | 200,000 |
| Raw materials | 48,000 |
| Direct labour | 28,000 |
| Variable manufacturing overhead | 18,000 |
| Total variable manufacturing cost | 94,000 |
| Variable distribution/admin | 9,000 |
| Total variable costs | 103,000 |
| Contribution | 97,000 |
| Fixed manufacturing overhead | 14,000 |
| Fixed distribution/admin | 10,000 |
| Total fixed costs | 24,000 |
| Profit | 73,000 |
No opening or closing inventory adjustment is supplied; the stated operating costs are treated as costs for the sales period.
Question 5(b) — 8 marks
Outline four types of responsibility centres in performance evaluation.
Answer
- Cost centre: a manager is accountable primarily for controllable costs and efficient use of resources, such as a maintenance department.
- Revenue centre: a manager is accountable primarily for generating revenue, such as a sales territory with limited control over production costs.
- Profit centre: a manager controls both revenue and costs and is evaluated on the resulting profit.
- Investment centre: a manager is accountable for profit and the assets or capital used to earn it, assessed using measures such as ROI and residual income.
Question 6(a) — 8 marks
A company has three sources of grains, X, Y and Z, which supply to warehouses located at A, B, C, D and E. The supply available from the three sources is 1,800 bags, 1,400 bags and 1,800 bags per month. The monthly demand of the warehouses is 800 bags, 800 bags, 1,000 bags, 800 bags and 1,600 bags, respectively. The following is the unit cost of transportation, in Kenya shillings, from each source to each warehouse.
Source A B C D E X 10 16 12 12 6 Y 8 14 14 12 12 Z 16 8 12 12 9 Determine the:
(i) optimum distribution schedule, using North-West Corner rule in order to minimize the total cost of transportation;
(ii) minimum total cost, according to the schedule determined in (i) above.
Answer
NW allocation steps:
| Step | Route | Selection | Quantity |
|---|---|---|---|
| 1 | X → A | unit cost 10 | 800 |
| 2 | X → B | unit cost 16 | 800 |
| 3 | X → C | unit cost 12 | 200 |
| 4 | Y → C | unit cost 14 | 800 |
| 5 | Y → D | unit cost 12 | 600 |
| 6 | Z → D | unit cost 12 | 200 |
| 7 | Z → E | unit cost 9 | 1,600 |
Initial basic feasible schedule:
| Source → destination | A | B | C | D | E | Supply |
|---|---|---|---|---|---|---|
| X | 800 | 800 | 200 | 0 | 0 | 1,800 |
| Y | 0 | 0 | 800 | 600 | 0 | 1,400 |
| Z | 0 | 0 | 0 | 200 | 1,600 | 1,800 |
| Demand | 800 | 800 | 1,000 | 800 | 1,600 | 5,000 |
Initial transportation cost = Σ(quantity × unit cost) = 58,400 Ksh.
The initial allocation method produces a feasible schedule, but does not by itself prove minimum cost. Apply MODI: uᵢ + vⱼ = cᵢⱼ on basic cells and Δᵢⱼ = cᵢⱼ − uᵢ − vⱼ on nonbasic cells. A negative Δ permits a cost reduction; adjust alternating +/− cells by θ. Zero basic allocations may be used for degeneracy.
| Iteration | Entering route | Δ per unit | θ | Alternating loop | New total cost |
|---|---|---|---|---|---|
| 1 | X → E | -1 | 200 | +X→E; −Z→E; +Z→D; −Y→D; +Y→C; −X→C | 58,200 |
| 2 | Y → A | -5 | 400 | +Y→A; −X→A; +X→E; −Z→E; +Z→D; −Y→D | 56,200 |
| 3 | X → C | -4 | 400 | +X→C; −Y→C; +Y→A; −X→A | 54,600 |
| 4 | Y → B | -4 | 600 | +Y→B; −X→B; +X→C; −Y→C | 52,200 |
| 5 | Z → B | -11 | 200 | +Z→B; −X→B; +X→E; −Z→E | 50,000 |
| 6 | Y → C | -7 | 600 | +Y→C; −X→C; +X→E; −Z→E; +Z→B; −Y→B | 45,800 |
| 7 | Z → C | -3 | 200 | +Z→C; −X→C; +X→E; −Z→E | 45,200 |
| 8 | Y → D | -2 | 600 | +Y→D; −Z→D; +Z→C; −Y→C | 44,000 |
Optimal schedule:
| Source → destination | A | B | C | D | E | Supply |
|---|---|---|---|---|---|---|
| X | 0 | 0 | 200 | 0 | 1,600 | 1,800 |
| Y | 800 | 0 | 0 | 600 | 0 | 1,400 |
| Z | 0 | 800 | 800 | 200 | 0 | 1,800 |
| Demand | 800 | 800 | 1,000 | 800 | 1,600 | 5,000 |
| Row potentials u | X | Y | Z |
|---|---|---|---|
| Value | 0 | 0 | 0 |
| Column potentials v | A | B | C | D | E |
|---|---|---|---|---|---|
| Value | 8 | 8 | 12 | 12 | 6 |
Final reduced costs (all are nonnegative, proving optimality):
| A | B | C | D | E | |
|---|---|---|---|---|---|
| X | 2 | 8 | 0 | 0 | 0 |
| Y | 0 | 6 | 2 | 0 | 6 |
| Z | 8 | 0 | 0 | 0 | 3 |
Cost working: 200 × 12 + 1,600 × 6 + 800 × 8 + 600 × 12 + 800 × 8 + 800 × 12 + 200 × 12 = 44,000 Ksh.
Question 6(b) — 12 marks
Two divisions, A and B in a company are considering to invest in a new project. The following information relates to the two divisions.
Item Division A Division B Investment outlay (Ksh) 200,000 200,000 Net return on new investment (Ksh) 32,000 22,000 Current ROI 18% 11% The company’s cost of capital is 13%. Using each of the following approaches, advise each division on whether to accept the new investment or not:
(i) Return on Investment (ROI).
(ii) Residual Income (RI).
Answer
- Division A’s project ROI is 16%, below its current 18%; a manager evaluated only on maintaining current ROI may reject it. Its RI is positive Ksh. 6,000, so the company should accept it because it exceeds the 13% capital charge.
- Division B’s project ROI is 11%, equal to its current ROI, so it leaves that ratio unchanged. Its RI is negative Ksh. 4,000, and 11% is below the 13% required return; the company should reject it.
- Residual income aligns these decisions with earning the required capital return. The divisional ROI comparison alone can discourage a worthwhile project in a high-return division.
| Measure | A | B |
|---|---|---|
| Project ROI | 32,000 ÷ 200,000 = 16% | 22,000 ÷ 200,000 = 11% |
| Capital charge | 200,000 × 13% = 26,000 | 200,000 × 13% = 26,000 |
| Residual income | 32,000 − 26,000 = 6,000 | 22,000 − 26,000 = −4,000 |
Question 7(a) — 8 marks
A company intends to assign four jobs J1, J2, J3 and J4 to four employees, E1, E2, E3 and E4. The following are the wages, in Kenya shillings, payable to each employee for each particular job.
Employee J1 J2 J3 J4 E1 5,200 6,400 6,800 6,000 E2 4,000 8,400 7,200 5,200 E3 4,000 6,000 11,200 8,000 E4 4,800 5,000 8,400 7,500 Determine the:
(i) employee to be assigned to each job in order to minimize the total wages;
(ii) total minimum wages.
Answer
Apply the Hungarian method. Reduce each row by its smallest entry, then reduce each column by its smallest entry.
After row reduction:
| J1 | J2 | J3 | J4 | |
|---|---|---|---|---|
| E1 | 0 | 1,200 | 1,600 | 800 |
| E2 | 0 | 4,400 | 3,200 | 1,200 |
| E3 | 0 | 2,000 | 7,200 | 4,000 |
| E4 | 0 | 200 | 3,600 | 2,700 |
After column reduction:
| J1 | J2 | J3 | J4 | |
|---|---|---|---|---|
| E1 | 0 | 1,000 | 0 | 0 |
| E2 | 0 | 4,200 | 1,600 | 400 |
| E3 | 0 | 1,800 | 5,600 | 3,200 |
| E4 | 0 | 0 | 2,000 | 1,900 |
Cover zeros with rows E1 and columns J1, J2. Minimum uncovered entry = 400. Subtract it from uncovered cells and add it at line intersections.
| J1 | J2 | J3 | J4 | |
|---|---|---|---|---|
| E1 | 400 | 1,400 | 0 | 0 |
| E2 | 0 | 4,200 | 1,200 | 0 |
| E3 | 0 | 1,800 | 5,200 | 2,800 |
| E4 | 0 | 0 | 1,600 | 1,500 |
Choose four independent zeros, with one assignment in every row and column. Read the values from the original table:
| Assign | To | Ksh |
|---|---|---|
| E1 | J3 | 6,800 |
| E2 | J4 | 5,200 |
| E3 | J1 | 4,000 |
| E4 | J2 | 5,000 |
| Minimum | 21,000 |
Question 7(b) — 12 marks
Hassan operates a chain of supermarkets in a city. He is considering two options to increase revenues across the chains. The following is the estimated impact of the two options on the sales and their respective probabilities.
Item Reduce prices Launch loyalty card Cost of option (Ksh) 800,000 600,000 Probability of high sales 0.80 0.70 Probability of low sales 0.20 0.30 Result of high sales (Ksh) 1,600,000 2,000,000 Result of low sales (Ksh) 1,000,000 1,500,000 (i) Present the above information in a decision tree.
(ii) Using the Expected Monetary Value (EMV) approach, advise the management on the option to take.
Answer
- Use each option’s own high/low probabilities; they are not identical. The expected sales values are Ksh. 1,480,000 for reduced prices and Ksh. 1,850,000 for the loyalty card.
- On the supplied sales-less-option-cost basis, choose the loyalty card: Ksh. 1,250,000 versus Ksh. 680,000, a Ksh. 570,000 expected advantage.
- The source calls the outcomes sales, rather than contribution or profit. This comparison assumes other relevant operating costs are equal or already accounted for; a full profit decision would also require those costs.
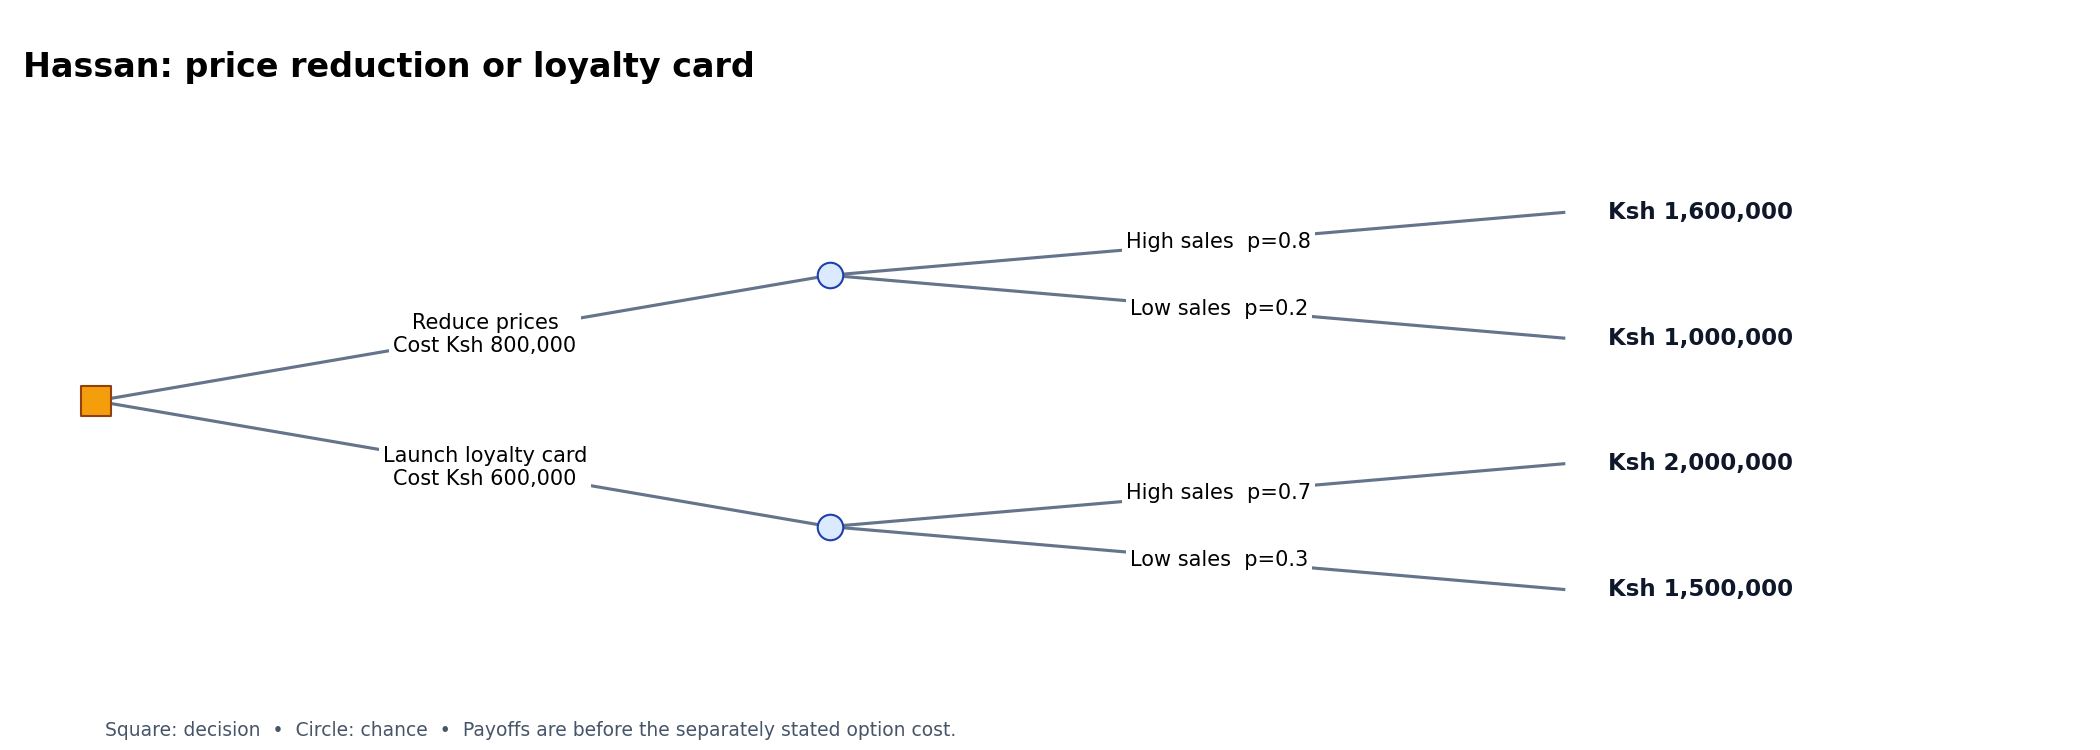
| Option | Expected sales working | Expected sales (Ksh) | Option cost (Ksh) | Sales less option cost (Ksh) |
|---|---|---|---|---|
| Reduce prices | .8 × 1,600,000 + .2 × 1,000,000 | 1,480,000 | 800,000 | 680,000 |
| Loyalty card | .7 × 2,000,000 + .3 × 1,500,000 | 1,850,000 | 600,000 | 1,250,000 |