Managerial Accounting — 2022
KNEC Diploma in Supply Chain Management, Module III. Original examination questions with explained answers for revision. Answers are independently prepared for study and are not an official KNEC marking scheme.
July 2022
Paper codes: 2903/305; 2906/305; 2907/305; 2926/305; 3103
Question 1(a) — 8 marks
Explain four functions of Managerial Accounting in a business organisation.
Answer
- Planning: prepare forecasts, budgets and cost estimates that turn objectives into measurable resource requirements.
- Decision support: compare relevant future revenues and costs of alternatives such as making or buying, pricing and investing.
- Control: compare actual results with budgets, investigate significant variances and recommend corrective action.
- Performance evaluation: report controllable results for responsibility centres so managers can assess efficiency and achievement of targets.
Question 1(b) — 12 marks
Hamza Limited manufactures and sells product HM20. The following information relates to the company for the year 2020.
Item Amount Production (units) 18,000 Sales (units) 15,000 Direct materials (Ksh) 864,000 Direct labour (Ksh) 360,000 Variable production overheads (Ksh) 144,000 Fixed production overheads (Ksh) 120,000 Administration costs (Ksh) 70,000 Additional information: (I) Selling price is Ksh 100. (II) Variable selling overheads per unit amounted to Ksh 3. (III) There was no opening stock. Prepare income statement, using the marginal costing technique.
Answer
| Item | Working | Result |
|---|---|---|
| Variable manufacturing cost | 864,000 + 360,000 + 144,000 | 1,368,000 |
| Variable manufacturing cost/unit | 1,368,000 ÷ 18,000 | 76 |
| Closing inventory | 3,000 × 76 | 228,000 |
| Marginal income statement (Ksh) | Amount |
|---|---|
| Sales: 15,000 × 100 | 1,500,000 |
| Variable production cost | 1,368,000 |
| Less closing stock | -228,000 |
| Variable cost of goods sold | 1,140,000 |
| Variable selling: 15,000 × 3 | 45,000 |
| Contribution | 315,000 |
| Fixed production overhead | 120,000 |
| Administration | 70,000 |
| Profit | 125,000 |
Question 2(a) — 8 marks
Explain four assumptions of a simple queuing model.
Answer
- One service channel handles customers from a single waiting line.
- Arrivals are independent and random, normally represented by a Poisson process with a constant mean rate.
- Service times are independent and exponentially distributed with a constant mean service rate.
- For the usual steady-state M/M/1 results, the service rate exceeds the arrival rate; customers normally follow first-come, first-served discipline.
Question 2(b) — 12 marks
The following information relates to the performance of five students in two examinations, Mathematics and History.
Student Mathematics (%) History (%) A 80 50 B 60 60 C 90 40 D 50 90 E 80 60 Using the method of ordinary least squares, determine the:
(i) regression equation;
(ii) marks scored in History by a student who scores 78% in Mathematics.
Answer
| Mathematics (%) x | History (%) y | x² | xy |
|---|---|---|---|
| 80 | 50 | 6,400 | 4,000 |
| 60 | 60 | 3,600 | 3,600 |
| 90 | 40 | 8,100 | 3,600 |
| 50 | 90 | 2,500 | 4,500 |
| 80 | 60 | 6,400 | 4,800 |
| Σ | 300 | 27,000 | 20,500 |
| Item | Working | Result |
|---|---|---|
| Totals | n=5; Σx=360; Σy=300 | |
| Slope b | [5 × 20,500 − 360 × 300] ÷ [5 × 27,000 − 360²] | -1.018519 |
| Intercept a | [300 − (-1.018519 × 360)] ÷ 5 | 133.333333 |
| Regression equation | ŷ = a + bx | ŷ = 133.333333 + (-1.018519)x |
| Prediction at x=78 | 133.333333 + (-1.018519 × 78) | 53.89 |
This is an estimated History percentage from the fitted relationship, not a guaranteed individual score.
Question 3(a) — 10 marks
The following is the summarized income statement of Bundix Limited for the year ended 31 December 2020.
Item Ksh Sales (1,000 units) 12,000,000 Less costs (25% variable) 8,000,000 Profit 4,000,000 (i) Calculate the: (I) break even point in units and in shillings; (II) margin of safety in units and in shillings.
(ii) Determine the number of units that should be sold in order to make a profit of Ksh 5,000,000.
Answer
| Item | Working | Result |
|---|---|---|
| Price per unit | 12,000,000 ÷ 1,000 | 12,000 |
| Variable cost/unit | 8,000,000 × 25% ÷ 1,000 | 2,000 |
| Fixed cost | 8,000,000 × 75% | 6,000,000 |
| Contribution/unit | 12,000 − 2,000 | 10,000 |
| Break-even units | 6,000,000 ÷ 10,000 | 600 |
| Break-even sales | 600 × 12,000 | 7,200,000 |
| Margin of safety units | 1,000 − 600 | 400 |
| MOS sales | 400 × 12,000 | 4,800,000 |
| Units for target profit | (6,000,000 + 5,000,000) ÷ 10,000 | 1,100 |
Question 3(b) — 10 marks
Maxim Limited has four branches located in Nairobi, Mombasa, Kisumu and Nakuru. The firm engages four companies, A, B, C and D, to install computer systems in the four branches. Each company is assigned to one branch. The fees charged by each company, in thousands of shillings, is as shown below:
Company Nairobi Mombasa Kisumu Nakuru A 840 700 420 560 B 700 420 350 840 C 210 490 630 420 D 560 490 280 560 Determine the:
(i) assignment schedule that will minimize costs;
(ii) total minimum cost.
Answer
Apply the Hungarian method. Reduce each row by its smallest entry, then reduce each column by its smallest entry.
After row reduction:
| Nairobi | Mombasa | Kisumu | Nakuru | |
|---|---|---|---|---|
| A | 420 | 280 | 0 | 140 |
| B | 350 | 70 | 0 | 490 |
| C | 0 | 280 | 420 | 210 |
| D | 280 | 210 | 0 | 280 |
After column reduction:
| Nairobi | Mombasa | Kisumu | Nakuru | |
|---|---|---|---|---|
| A | 420 | 210 | 0 | 0 |
| B | 350 | 0 | 0 | 350 |
| C | 0 | 210 | 420 | 70 |
| D | 280 | 140 | 0 | 140 |
Choose four independent zeros, with one assignment in every row and column. Read the values from the original table:
| Assign | To | Ksh ‘000 |
|---|---|---|
| A | Nakuru | 560 |
| B | Mombasa | 420 |
| C | Nairobi | 210 |
| D | Kisumu | 280 |
| Minimum | 1,470 |
Minimum cost = Ksh. 1,470,000.
Question 4(a) — 8 marks
Explain four functions of budgets in a business organisation.
Answer
- Planning: quantify expected activities, income, expenditure and financing requirements before operations begin.
- Coordination: reconcile sales, production, purchasing and cash plans so departments work from consistent assumptions.
- Communication and responsibility: tell managers their targets and the resources authorised to achieve them.
- Control and evaluation: compare actual results with the budget, investigate variances and take corrective action.
Question 4(b) — 12 marks
Lakut Limited intends to invest in the following projects.
Project Initial investment (Ksh) Total PV of inflows (Ksh) A 1,300,000 900,000 B 1,600,000 2,100,000 C 1,700,000 1,770,000 D 900,000 950,000 (i) For each of the projects, calculate the profitability index (PI).
(ii) Rank the projects in order of profitability index (PI).
Answer
- Profitability index = total present value of future cash inflows ÷ initial investment. Rank B, D, C, A, from highest to lowest PI.
- B, D and C have PI above 1 and positive NPV; A has PI below 1. If capital is restricted, the final investment combination also depends on the budget and project divisibility, neither of which is supplied.
| Project | PI working | PI | NPV (Ksh) | Rank |
|---|---|---|---|---|
| A | 900,000 ÷ 1,300,000 | 0.6923 | -400,000 | 4 |
| B | 2,100,000 ÷ 1,600,000 | 1.3125 | 500,000 | 1 |
| C | 1,770,000 ÷ 1,700,000 | 1.0412 | 70,000 | 3 |
| D | 950,000 ÷ 900,000 | 1.0556 | 50,000 | 2 |
Question 5(a) — 8 marks
Randip Limited has two divisions: K and L. Division K expects to earn a profit of Ksh 100,000 on an investment of 5,000,000 while Division L expects to earn a profit of Ksh 1,500,000 on an investment of Ksh 10,000,000. The shareholders’ required rate of return is 16%.
(i) Determine the Residual Income (RI) of the two divisions.
(ii) Based on the results in (i) above, advise the management on the most profitable division.
Answer
- Division L is better on residual income because its shortfall is Ksh. 100,000, compared with K’s Ksh. 700,000. However, neither division earns the shareholders’ required return, since both residual incomes are negative.
| Division | Profit (Ksh) | Capital charge: 16% × investment | Residual income (Ksh) |
|---|---|---|---|
| K | 100,000 | 800,000 | -700,000 |
| L | 1,500,000 | 1,600,000 | -100,000 |
Question 5(b) — 12 marks
Mwanzu Traders is in the process of preparing a cash budget for the year 2022. The following estimates have been provided:
Item Dec 2021 Jan 2022 Feb 2022 Mar 2022 Apr 2022 Purchases (Ksh) 40,200 70,800 29,520 36,080 34,500 Sales (Ksh) 38,400 40,200 48,300 36,900 45,100 Wages (Ksh) 14,000 14,000 14,000 18,000 18,000 Additional information: (I) All purchases and sales are made on credit. (II) Creditors are paid 25% in the month of purchase and the balance in the month following. (III) Debtors pay 50% in the month of sale and the balance in the month following. (IV) Wages are paid in the month they are incurred. (V) An office printer costing Ksh 8,000 is to be bought in February 2022. (VI) The cash balance as at 1 January 2022 is expected to be Ksh 100,500. Prepare a cash budget for each of the months of January, February and March 2022.
Answer
| Cash budget (Ksh) | January | February | March |
|---|---|---|---|
| Opening cash | 100,500 | 77,950 | 39,720 |
| 50% current sales | 20,100 | 24,150 | 18,450 |
| 50% prior sales | 19,200 | 20,100 | 24,150 |
| Total receipts | 39,300 | 44,250 | 42,600 |
| 25% current purchases | 17,700 | 7,380 | 9,020 |
| 75% prior purchases | 30,150 | 53,100 | 22,140 |
| Wages | 14,000 | 14,000 | 18,000 |
| Printer | 0 | 8,000 | 0 |
| Total payments | 61,850 | 82,480 | 49,160 |
| Net cash movement | -22,550 | -38,230 | -6,560 |
| Closing cash | 77,950 | 39,720 | 33,160 |
Question 6(a) — 10 marks
The following table shows the weekly sales, in thousands of shillings, made by four sales persons, Rael, Halima, Moses and Trevor, in four different towns: A, B, C and D.
Sales person A B C D Rael 10 25 5 4 Halima 12 23 9 2 Moses 14 20 8 1 Trevor 13 20 7 3 The management intends to assign the sales persons to the towns in order to maximize sales. Determine the:
(i) optimal assignment schedule that maximizes weekly sales;
(ii) maximum weekly sales.
Answer
Maximise by converting each entry to an opportunity loss: 25 minus the original entry. Apply the Hungarian method. Reduce each row by its smallest entry, then reduce each column by its smallest entry.
After row reduction:
| A | B | C | D | |
|---|---|---|---|---|
| Rael | 15 | 0 | 20 | 21 |
| Halima | 11 | 0 | 14 | 21 |
| Moses | 6 | 0 | 12 | 19 |
| Trevor | 7 | 0 | 13 | 17 |
After column reduction:
| A | B | C | D | |
|---|---|---|---|---|
| Rael | 9 | 0 | 8 | 4 |
| Halima | 5 | 0 | 2 | 4 |
| Moses | 0 | 0 | 0 | 2 |
| Trevor | 1 | 0 | 1 | 0 |
Cover zeros with rows Moses and columns B, D. Minimum uncovered entry = 1. Subtract it from uncovered cells and add it at line intersections.
| A | B | C | D | |
|---|---|---|---|---|
| Rael | 8 | 0 | 7 | 4 |
| Halima | 4 | 0 | 1 | 4 |
| Moses | 0 | 1 | 0 | 3 |
| Trevor | 0 | 0 | 0 | 0 |
Cover zeros with rows Moses, Trevor and columns B. Minimum uncovered entry = 1. Subtract it from uncovered cells and add it at line intersections.
| A | B | C | D | |
|---|---|---|---|---|
| Rael | 7 | 0 | 6 | 3 |
| Halima | 3 | 0 | 0 | 3 |
| Moses | 0 | 2 | 0 | 3 |
| Trevor | 0 | 1 | 0 | 0 |
Choose four independent zeros, with one assignment in every row and column. Read the values from the original table:
| Assign | To | Ksh ‘000 |
|---|---|---|
| Rael | B | 25 |
| Halima | C | 9 |
| Moses | A | 14 |
| Trevor | D | 3 |
| Maximum | 51 |
Maximum weekly sales = Ksh. 51,000.
Question 6(b) — 10 marks
Konti Limited intends to invest Ksh 1,500,000 in either project M or project N. The expected net cash inflows from each of the projects is as follows.
Year Project M (Ksh) Project N (Ksh) 1 600,000 550,000 2 1,010,000 970,000 3 710,000 820,000 Additional information: (I) The company’s cost of capital is 14%. (II) Project M is expected to have a salvage value of Ksh 100,000.
(i) For each of the projects, M and N, determine the Net Present Value (NPV).
(ii) Based on the results in (i) above, advise the management on the project to undertake.
Answer
- Add M’s Ksh. 100,000 salvage value to its Ksh. 710,000 year-3 inflow. No salvage value is specified for N.
- Choose project M: NPV M = Ksh. 350,204.92, versus NPV N = Ksh. 282,316.29. Both are positive, but M creates more value for the same initial outlay.
Project M (including year-3 salvage): discount rate 14%. PV = cash flow ÷ (1 + r)ⁿ. All amounts are Ksh.
| Year | Net cash flow | Discount factor | Present value |
|---|---|---|---|
| 1 | 600,000 | 0.877193 | 526,315.79 |
| 2 | 1,010,000 | 0.769468 | 777,162.20 |
| 3 | 810,000 | 0.674972 | 546,726.93 |
| Total PV | 1,850,204.92 | ||
| Initial investment (time 0) | -1,500,000 | ||
| NPV | 350,204.92 |
Project N: discount rate 14%. PV = cash flow ÷ (1 + r)ⁿ. All amounts are Ksh.
| Year | Net cash flow | Discount factor | Present value |
|---|---|---|---|
| 1 | 550,000 | 0.877193 | 482,456.14 |
| 2 | 970,000 | 0.769468 | 746,383.50 |
| 3 | 820,000 | 0.674972 | 553,476.64 |
| Total PV | 1,782,316.29 | ||
| Initial investment (time 0) | -1,500,000 | ||
| NPV | 282,316.29 |
Question 7(a) — 10 marks
Kapet Limited intends to launch either product Y or product Z into the market. The following information relates to the net profit and the associated probabilities of the two products under three different market conditions.
Market condition Probability Y (Ksh ‘000) Z (Ksh ‘000) Boom 0.30 180 280 Neutral 0.45 140 90 Recession 0.25 40 5 (i) For each product, calculate: (I) expected net profit; (II) standard deviation; (III) coefficient of variation.
(ii) Based on the results in (III) above, advise the management on the product to launch.
Answer
- Choose product Y on the requested coefficient-of-variation criterion: it has a lower standard deviation per unit of expected profit. Y also has a slightly higher expected profit.
Use μ = Σpx, variance = Σp(x − μ)², standard deviation σ = √variance and CV = σ/μ. Profit and standard deviation below are in Ksh ‘000; variance is in squared thousand-shilling units.
Product Y
| State | p | Profit x | x − μ | p(x − μ)² |
|---|---|---|---|---|
| Boom | 0.30 | 180 | 53 | 842.70 |
| Neutral | 0.45 | 140 | 13 | 76.05 |
| Recession | 0.25 | 40 | -87 | 1,892.25 |
Product Z
| State | p | Profit x | x − μ | p(x − μ)² |
|---|---|---|---|---|
| Boom | 0.30 | 280 | 154.25 | 7,137.92 |
| Neutral | 0.45 | 90 | -35.75 | 575.13 |
| Recession | 0.25 | 5 | -120.75 | 3,645.14 |
| Product | Expected profit | Variance | Standard deviation | CV ratio | CV percentage |
|---|---|---|---|---|---|
| Y | 127 | 2,811 | 53.02 | 0.417471 | 41.75% |
| Z | 125.75 | 11,358.19 | 106.57 | 0.847513 | 84.75% |
Question 7(b) — 10 marks
Tamu Butcheries has three butcheries: X, Y and Z. The butcheries have the following quantities of meat available.
Butchery Meat available (kg) X 160 Y 170 Z 172 Three hotels, Sunlight, Topex and Highland require meat as follows:
Hotel Meat required (kg) Sunlight 158 Topex 150 Highland 194 The transportation cost, in shillings per kilogram of meat, from each of the butcheries to the hotels is as shown below:
Butchery Sunlight Topex Highland X 10 7 9 Y 12 10 8 Z 17 12 6.50 Using the North West Corner rule, determine the:
(i) optimal transportation schedule;
(ii) minimum cost of transportation.
Answer
NW allocation steps:
| Step | Route | Selection | Quantity |
|---|---|---|---|
| 1 | X → Sunlight | unit cost 10 | 158 |
| 2 | X → Topex | unit cost 7 | 2 |
| 3 | Y → Topex | unit cost 10 | 148 |
| 4 | Y → Highland | unit cost 8 | 22 |
| 5 | Z → Highland | unit cost 6.50 | 172 |
Initial basic feasible schedule:
| Source → destination | Sunlight | Topex | Highland | Supply |
|---|---|---|---|---|
| X | 158 | 2 | 0 | 160 |
| Y | 0 | 148 | 22 | 170 |
| Z | 0 | 0 | 172 | 172 |
| Demand | 158 | 150 | 194 | 502 |
Initial transportation cost = Σ(quantity × unit cost) = 4,368 Ksh.
The initial allocation method produces a feasible schedule, but does not by itself prove minimum cost. Apply MODI: uᵢ + vⱼ = cᵢⱼ on basic cells and Δᵢⱼ = cᵢⱼ − uᵢ − vⱼ on nonbasic cells. A negative Δ permits a cost reduction; adjust alternating +/− cells by θ. Zero basic allocations may be used for degeneracy.
| Iteration | Entering route | Δ per unit | θ | Alternating loop | New total cost |
|---|---|---|---|---|---|
| 1 | Y → Sunlight | -1 | 148 | +Y→Sunlight; −X→Sunlight; +X→Topex; −Y→Topex | 4,220 |
Optimal schedule:
| Source → destination | Sunlight | Topex | Highland | Supply |
|---|---|---|---|---|
| X | 10 | 150 | 0 | 160 |
| Y | 148 | 0 | 22 | 170 |
| Z | 0 | 0 | 172 | 172 |
| Demand | 158 | 150 | 194 | 502 |
| Row potentials u | X | Y | Z |
|---|---|---|---|
| Value | 0 | 2 | 0.50 |
| Column potentials v | Sunlight | Topex | Highland |
|---|---|---|---|
| Value | 10 | 7 | 6 |
Final reduced costs (all are nonnegative, proving optimality):
| Sunlight | Topex | Highland | |
|---|---|---|---|
| X | 0 | 0 | 3 |
| Y | 0 | 1 | 0 |
| Z | 6.50 | 4.50 | 0 |
Cost working: 10 × 10 + 150 × 7 + 148 × 12 + 22 × 8 + 172 × 6.50 = 4,220 Ksh.
November 2022
Paper codes: 2903/305; 2906/305; 2907/305; 2926/305; 3103
Question 1(a) — 8 marks
Explain four roles played by a management accountant in a business organization.
Answer
- Planning: prepare forecasts, budgets and cost estimates that turn objectives into measurable resource requirements.
- Decision support: compare relevant future revenues and costs of alternatives such as making or buying, pricing and investing.
- Control: compare actual results with budgets, investigate significant variances and recommend corrective action.
- Performance evaluation: report controllable results for responsibility centres so managers can assess efficiency and achievement of targets.
Question 1(b) — 12 marks
The management of Noli Limited intends to launch either product K or product M into the market. The following are the expected net profits or losses and associated probabilities under three market conditions.
Market demand Probability K (Ksh) M (Ksh) High 0.20 600,000 400,000 Medium 0.50 300,000 500,000 Low 0.30 -100,000 50,000 (i) Draw a decision tree to present the information above.
(ii) Calculate the Expected Monetary Value (EMV) for each of the products, K and M.
(iii) Based on the results in (ii) above, advise the management on the product to launch.
Answer
- Launch product M, whose EMV is Ksh. 345,000, compared with Ksh. 240,000 for K. Its expected advantage is Ksh. 105,000 under the supplied probabilities.
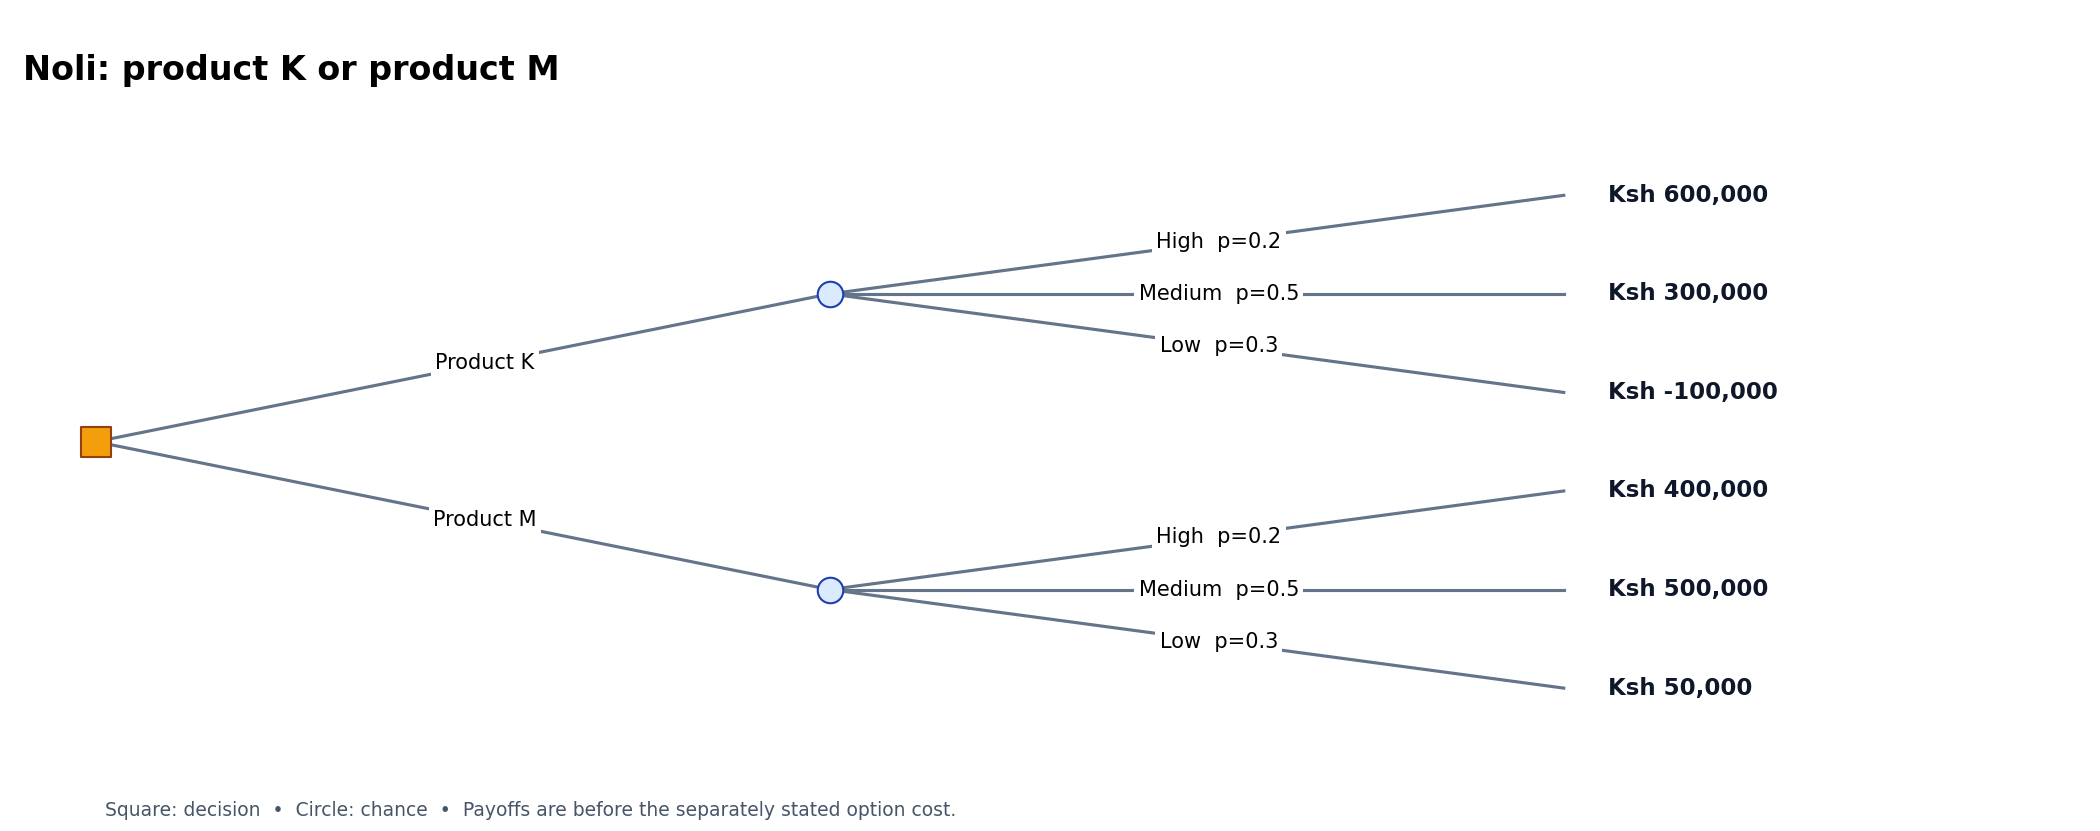
| Alternative | Σ probability × payoff | Expected gross payoff | Option cost | Net EMV (Ksh) |
|---|---|---|---|---|
| Product K | 0.2 × (600,000) + 0.5 × (300,000) + 0.3 × (-100,000) | 240,000 | 0 | 240,000 |
| Product M | 0.2 × (400,000) + 0.5 × (500,000) + 0.3 × (50,000) | 345,000 | 0 | 345,000 |
Question 2(a) — 8 marks
The following information relates to units produced of a product and the cost of production incurred by Kolo Manufacturers during the first six months of the year 2021.
2021 Units produced Cost of production (Ksh) January 500 20,000 February 300 18,000 March 700 28,000 April 350 19,000 May 200 15,000 June 600 25,000 (i) Using the high-low method, determine: (I) variable cost per unit; (II) fixed cost for the period. (ii) Formulate the linear cost function in the form of Y = a + bx. (iii) Estimate the production cost if 1,000 units are produced.
Answer
| Item | Working | Result |
|---|---|---|
| Highest activity | x = 700; cost = 28,000 | |
| Lowest activity | x = 200; cost = 15,000 | |
| Variable cost per unit | (28,000 − 15,000) ÷ (700 − 200) | 26 |
| Fixed cost | 28,000 − 26 × 700 | 9,800 |
| Cost function | Y = a + bx | Y = 9,800 + 26x |
| Cost at 1,000 units | 9,800 × 1 + 26 × 1,000 | 35,800 |
Select the highest and lowest activity levels, rather than the highest and lowest cost observations.
Question 2(b) — 12 marks
The following information relates to product JZ20 manufactured by Jako Limited:
Item Ksh Sales (400 units) 1,600,000 Less total costs 1,000,000 Profit 600,000 Fixed costs are 20% of the total costs. (i) Determine: (I) break-even point in units; (II) break-even point in shillings; (III) margin of safety in units; (IV) margin of safety in shillings; (V) contribution-sales ratio. (ii) Calculate the number of units to be manufactured and sold in order to obtain a target profit of Ksh. 124,000.
Answer
| Item | Working | Result |
|---|---|---|
| Selling price/unit | 1,600,000 ÷ 400 | 4,000 |
| Fixed costs | 20% × 1,000,000 | 200,000 |
| Variable cost/unit | 800,000 ÷ 400 | 2,000 |
| Contribution/unit | 4,000 − 2,000 | 2,000 |
| Break-even units | 200,000 ÷ 2,000 | 100 |
| Break-even sales | 100 × 4,000 | 400,000 |
| MOS units | 400 − 100 | 300 |
| MOS sales | 300 × 4,000 | 1,200,000 |
| Contribution-sales ratio | 2,000 ÷ 4,000 | 50% |
| Units for target profit | (200,000 + 124,000) ÷ 2,000 | 162 |
Question 3(a) — 10 marks
Saleb Limited produces three products: X, Y and Z. The following is the operating statement for the year ended 31 December 2021.
Item (Ksh) Product X Product Y Product Z Total Sales 100,000 150,000 140,000 390,000 Total sales (as printed) 120,000 90,000 99,000 309,000 Profit / loss -20,000 60,000 41,000 81,000 Additional information: Fixed costs are 1/3 of the total costs. The management is considering dropping product X.
(i) For each product, prepare an operating statement using marginal costing technique.
(ii) Advise the management on whether to drop product X or not.
Answer
- The printed row “Total sales” contains the total cost figures; it is treated as total costs, consistent with the stated profits.
- Keep product X if its allocated fixed costs continue. X contributes Ksh. 20,000 towards fixed costs; dropping it reduces total profit from Ksh. 81,000 to Ksh. 61,000. Only avoidable fixed costs or a better use of capacity could change that conclusion.
| Marginal operating statement (Ksh) | X | Y | Z | Total |
|---|---|---|---|---|
| Sales | 100,000 | 150,000 | 140,000 | 390,000 |
| Variable cost: 2/3 of cost | 80,000 | 60,000 | 66,000 | 206,000 |
| Contribution | 20,000 | 90,000 | 74,000 | 184,000 |
| Fixed cost: 1/3 of cost | 40,000 | 30,000 | 33,000 | 103,000 |
| Profit / loss | -20,000 | 60,000 | 41,000 | 81,000 |
| Item | Working | Result |
|---|---|---|
| Profit if X is dropped and all fixed costs remain | 81,000 − 20,000 | 61,000 |
Question 3(b) — 10 marks
Diam Limited intends to invest Ksh. 1,800,000 in either project A or project B. The following are the expected net cash inflows from the projects.
Year A (Ksh) B (Ksh) 1 -200,000 400,000 2 600,000 500,000 3 1,000,000 1,000,000 4 800,000 600,000 5 1,200,000 1,000,000 The cost of capital is 14%.
(i) Calculate the Net Present Value (NPV) for each project.
(ii) Advise the management on the project to invest in.
Answer
- Project A NPV = Ksh. 258,120.06; project B NPV = Ksh. 485,199.30. Choose B because it has the higher positive NPV. The negative year-1 cash flow for A is discounted as an outflow, not changed to an inflow.
Project A: discount rate 14%. PV = cash flow ÷ (1 + r)ⁿ. All amounts are Ksh.
| Year | Net cash flow | Discount factor | Present value |
|---|---|---|---|
| 1 | -200,000 | 0.877193 | -175,438.60 |
| 2 | 600,000 | 0.769468 | 461,680.52 |
| 3 | 1,000,000 | 0.674972 | 674,971.52 |
| 4 | 800,000 | 0.592080 | 473,664.22 |
| 5 | 1,200,000 | 0.519369 | 623,242.40 |
| Total PV | 2,058,120.06 | ||
| Initial investment (time 0) | -1,800,000 | ||
| NPV | 258,120.06 |
Project B: discount rate 14%. PV = cash flow ÷ (1 + r)ⁿ. All amounts are Ksh.
| Year | Net cash flow | Discount factor | Present value |
|---|---|---|---|
| 1 | 400,000 | 0.877193 | 350,877.19 |
| 2 | 500,000 | 0.769468 | 384,733.76 |
| 3 | 1,000,000 | 0.674972 | 674,971.52 |
| 4 | 600,000 | 0.592080 | 355,248.17 |
| 5 | 1,000,000 | 0.519369 | 519,368.66 |
| Total PV | 2,285,199.30 | ||
| Initial investment (time 0) | -1,800,000 | ||
| NPV | 485,199.30 |
Question 4(a) — 8 marks
Mobex Limited operates two divisions, P and Q. Both divisions have proposed similar investment projects worth Ksh. 20,000,000 each. Out of this investment, the controllable contribution is 14% of the proposed investment for division P, while division Q has estimated their controllable contribution to be 18%. The capital charge is 16% of the proposed investment for each division. Using the residual income approach, advise the management on the division whose project should be undertaken.
Answer
- Undertake division Q’s project: it earns Ksh. 400,000 above the capital charge. P’s project falls short by Ksh. 400,000.
| Division | Controllable contribution (Ksh) | Capital charge (Ksh) | Residual income (Ksh) |
|---|---|---|---|
| P | 20,000,000 × 14% = 2,800,000 | 3,200,000 | -400,000 |
| Q | 20,000,000 × 18% = 3,600,000 | 3,200,000 | 400,000 |
Question 4(b) — 12 marks
Saba Limited has four salespersons: Abdi, Moses, Lilian and Mary. Each salesperson is to be assigned to a single town. The following table shows the weekly sales in thousands of shillings, made by each salesperson in each of the towns.
Town Abdi Moses Lilian Mary A 20 16 13 18 B 10 14 16 13 C 14 6 10 18 D 16 12 8 15 Assign each salesperson to each town in order to maximize the total sales.
Answer
Maximise by converting each entry to an opportunity loss: 20 minus the original entry. Apply the Hungarian method. Reduce each row by its smallest entry, then reduce each column by its smallest entry.
After row reduction:
| Abdi | Moses | Lilian | Mary | |
|---|---|---|---|---|
| A | 0 | 4 | 7 | 2 |
| B | 6 | 2 | 0 | 3 |
| C | 4 | 12 | 8 | 0 |
| D | 0 | 4 | 8 | 1 |
After column reduction:
| Abdi | Moses | Lilian | Mary | |
|---|---|---|---|---|
| A | 0 | 2 | 7 | 2 |
| B | 6 | 0 | 0 | 3 |
| C | 4 | 10 | 8 | 0 |
| D | 0 | 2 | 8 | 1 |
Cover zeros with rows B and columns Abdi, Mary. Minimum uncovered entry = 2. Subtract it from uncovered cells and add it at line intersections.
| Abdi | Moses | Lilian | Mary | |
|---|---|---|---|---|
| A | 0 | 0 | 5 | 2 |
| B | 8 | 0 | 0 | 5 |
| C | 4 | 8 | 6 | 0 |
| D | 0 | 0 | 6 | 1 |
Choose four independent zeros, with one assignment in every row and column. Read the values from the original table:
| Assign | To | Ksh ‘000 |
|---|---|---|
| A | Abdi | 20 |
| B | Lilian | 16 |
| C | Mary | 18 |
| D | Moses | 12 |
| Maximum | 66 |
Maximum weekly sales = Ksh. 66,000.
Question 5(a) — 8 marks
A teller at Kiti savings and credit society can serve an average of one customer in every 3 minutes. On average, a customer arrives after every 4 minutes.
Using the simple queuing model, determine the:
(i) average number of customers in the queue;
(ii) average number of customers in the queuing system;
(iii) average time a customer spends in the system.
Answer
λ = 60/4 = 15 per hour; μ = 60/3 = 20 per hour.
Use the stable M/M/1 model: one server, Poisson arrivals, independent exponential service times and λ < μ. Service completions are counted per time interval; service durations are exponential.
| Item | Working | Result |
|---|---|---|
| Arrival rate λ | Convert arrivals to an hourly rate | 15 per hour |
| Service rate μ | Convert services to an hourly rate | 20 per hour |
| Busy proportion ρ | λ / μ | 0.7500 = 75.00% |
| Idle proportion P₀ | 1 − ρ | 0.2500 = 25.00% |
| Mean queue length Lq | λ² / [μ(μ − λ)] | 2.25 |
| Mean number in system L | λ / (μ − λ) | 3 |
| Mean time in system W | 1 / (μ − λ) | 0.200000 hour = 12 minutes |
| Mean waiting time Wq | λ / [μ(μ − λ)] | 0.150000 hour = 9 minutes = 540 seconds |
Question 5(b) — 12 marks
Ziwa Dairy Limited has three milk processing plants; A, B and C. The company supplies milk to four different towns; W, X, Y and Z. The daily quantity of milk available from the plants is as follows.
Plant Litres available A 5,000 B 8,000 C 7,000 The daily quantity of milk required in each of the towns is as shown below.
Town Litres required W 4,000 X 6,000 Y 7,000 Z 5,000 The cost of transporting one litre of milk from each plant to each of the towns, in Kenya shillings, is as shown below.
Plant W X Y Z A 2 5 4 3 B 4 1 5 4 C 3 2 2 3 Using the North-West corner rule, determine the:
(i) optimal transportation schedule that will minimize transportation cost;
(ii) minimum transportation cost.
Answer
Demand exceeds available supply by 2,000. Add a dummy source of 2,000 at zero accounting transport cost to balance the tableau. Dummy allocations represent unmet demand, not actual deliveries; real shortage penalties are not supplied.
NW allocation steps:
| Step | Route | Selection | Quantity |
|---|---|---|---|
| 1 | A → W | unit cost 2 | 4,000 |
| 2 | A → X | unit cost 5 | 1,000 |
| 3 | B → X | unit cost 1 | 5,000 |
| 4 | B → Y | unit cost 5 | 3,000 |
| 5 | C → Y | unit cost 2 | 4,000 |
| 6 | C → Z | unit cost 3 | 3,000 |
| 7 | Dummy (unmet demand) → Z | unit cost 0 | 2,000 |
Initial basic feasible schedule:
| Source → destination | W | X | Y | Z | Supply |
|---|---|---|---|---|---|
| A | 4,000 | 1,000 | 0 | 0 | 5,000 |
| B | 0 | 5,000 | 3,000 | 0 | 8,000 |
| C | 0 | 0 | 4,000 | 3,000 | 7,000 |
| Dummy (unmet demand) | 0 | 0 | 0 | 2,000 | 2,000 |
| Demand | 4,000 | 6,000 | 7,000 | 5,000 | 22,000 |
Initial transportation cost = Σ(quantity × unit cost) = 50,000 Ksh.
The initial allocation method produces a feasible schedule, but does not by itself prove minimum cost. Apply MODI: uᵢ + vⱼ = cᵢⱼ on basic cells and Δᵢⱼ = cᵢⱼ − uᵢ − vⱼ on nonbasic cells. A negative Δ permits a cost reduction; adjust alternating +/− cells by θ. Zero basic allocations may be used for degeneracy.
| Iteration | Entering route | Δ per unit | θ | Alternating loop | New total cost |
|---|---|---|---|---|---|
| 1 | A → Y | -5 | 1,000 | +A→Y; −B→Y; +B→X; −A→X | 45,000 |
| 2 | A → Z | -2 | 1,000 | +A→Z; −C→Z; +C→Y; −A→Y | 43,000 |
| 3 | B → W | -1 | 2,000 | +B→W; −A→W; +A→Z; −C→Z; +C→Y; −B→Y | 41,000 |
| 4 | B → Z | -1 | 2,000 | +B→Z; −A→Z; +A→W; −B→W | 39,000 |
Optimal schedule:
| Source → destination | W | X | Y | Z | Supply |
|---|---|---|---|---|---|
| A | 4,000 | 0 | 0 | 1,000 | 5,000 |
| B | 0 | 6,000 | 0 | 2,000 | 8,000 |
| C | 0 | 0 | 7,000 | 0 | 7,000 |
| Dummy (unmet demand) | 0 | 0 | 0 | 2,000 | 2,000 |
| Demand | 4,000 | 6,000 | 7,000 | 5,000 | 22,000 |
| Row potentials u | A | B | C | Dummy (unmet demand) |
|---|---|---|---|---|
| Value | 0 | 1 | 0 | -3 |
| Column potentials v | W | X | Y | Z |
|---|---|---|---|---|
| Value | 2 | 0 | 2 | 3 |
Final reduced costs (all are nonnegative, proving optimality):
| W | X | Y | Z | |
|---|---|---|---|---|
| A | 0 | 5 | 2 | 0 |
| B | 1 | 0 | 2 | 0 |
| C | 1 | 2 | 0 | 0 |
| Dummy (unmet demand) | 1 | 3 | 1 | 0 |
Cost working: 4,000 × 2 + 1,000 × 3 + 6,000 × 1 + 2,000 × 4 + 7,000 × 2 + 2,000 × 0 = 39,000 Ksh.
Question 6(a) — 8 marks
Explain each of the following terms as used in queuing.
(i) Queue discipline;
(ii) Queuing system;
(iii) Multi-channel service facility;
(iv) Waiting time.
Answer
- Queue discipline: the rule deciding which waiting customer receives service next, such as first-come, first-served or priority order.
- Queuing system: the complete arrangement of the calling population, arrival process, waiting space, service channels and service process.
- Multi-channel service facility: two or more parallel servers can serve customers at the same service stage, for example several bank tellers.
- Waiting time: time spent in the queue before service begins; distinguish it from time in the system, which also includes service time.
Question 6(b) — 12 marks
Mangy Limited manufactures two products, Wye and Zed, using two types of materials: M1 and M2.
The following estimates relate to the month of January 2023. Expected sales of product Wye and Zed are 10,000 units and 8,400 units respectively. Selling prices per unit are Ksh. 800 and Ksh. 500 respectively.
Material kg per unit Wye Zed M1 5 1 M2 2 3 Material cost per kilogram: M1 Ksh. 60; M2 Ksh. 100.
Finished goods inventory Wye Zed 1 January 280 360 31 January 320 340
Raw material inventory (kg) M1 M2 1 January 70 100 31 January 360 300 Prepare:
(i) sales budget in shillings;
(ii) production budget in units;
(iii) material usage budget in units;
(iv) material purchases budget in shillings.
Answer
Sales budget:
| Product | Sales units | Price (Ksh) | Sales value (Ksh) |
|---|---|---|---|
| Wye | 10,000 | 800 | 8,000,000 |
| Zed | 8,400 | 500 | 4,200,000 |
| Total | 12,200,000 |
Production = sales + closing finished goods − opening finished goods:
| Product | Sales | Add closing | Less opening | Produce units |
|---|---|---|---|---|
| Wye | 10,000 | 320 | 280 | 10,040 |
| Zed | 8,400 | 340 | 360 | 8,380 |
Material usage budget (kg):
| Material | Wye | Zed | Total kg |
|---|---|---|---|
| M1 | 50,200 | 8,380 | 58,580 |
| M2 | 20,080 | 25,140 | 45,220 |
Purchases = usage + closing raw material − opening raw material:
| Material | Usage kg | Add closing kg | Less opening kg | Purchase kg | Cost/kg (Ksh) | Purchases (Ksh) |
|---|---|---|---|---|---|---|
| M1 | 58,580 | 360 | 70 | 58,870 | 60 | 3,532,200 |
| M2 | 45,220 | 300 | 100 | 45,420 | 100 | 4,542,000 |
| Total | 8,074,200 |
Question 7(a) — 10 marks
Explain five advantages of decentralization in the management of a business organisation.
Answer
- Quicker decisions: local managers can respond to customer and operating issues without waiting for head-office approval.
- Better local information: decisions reflect detailed knowledge of regional markets, staff and production conditions.
- Manager development: delegated authority gives managers experience in planning, decision-making and accountability.
- Motivation: meaningful authority and responsibility can increase initiative and ownership of results.
- Senior management focus: routine decisions move to divisions, leaving top management more time for strategy and organisation-wide coordination.
Question 7(b) — 10 marks
The following information relates to the cost of production incurred by Aleem Limited for the year 2021.
Units produced Cost of production (Ksh ‘000) 10 8 12 10 14 10 15 14 16 15 20 18 (i) Formulate a linear regression equation in the form: Y = a + bx.
(ii) Estimate the cost of producing 30 units of the product.
Answer
| Units produced x | Cost y (Ksh ‘000) | x² | xy |
|---|---|---|---|
| 10 | 8 | 100 | 80 |
| 12 | 10 | 144 | 120 |
| 14 | 10 | 196 | 140 |
| 15 | 14 | 225 | 210 |
| 16 | 15 | 256 | 240 |
| 20 | 18 | 400 | 360 |
| Σ | 75 | 1,321 | 1,150 |
| Item | Working | Result |
|---|---|---|
| Totals | n=6; Σx=87; Σy=75 | |
| Slope b | [6 × 1,150 − 87 × 75] ÷ [6 × 1,321 − 87²] | 1.050420 |
| Intercept a | [75 − (1.050420 × 87)] ÷ 6 | -2.731092 |
| Regression equation | ŷ = a + bx | ŷ = -2.731092 + (1.050420)x |
| Prediction at x=30 | -2.731092 + (1.050420 × 30) | 28.78 |
The predicted cost in shillings is 28,781.51; the regression table and equation use Ksh ‘000.